## Diagram: Soft Thinking Process in a Large Language Model
### Overview
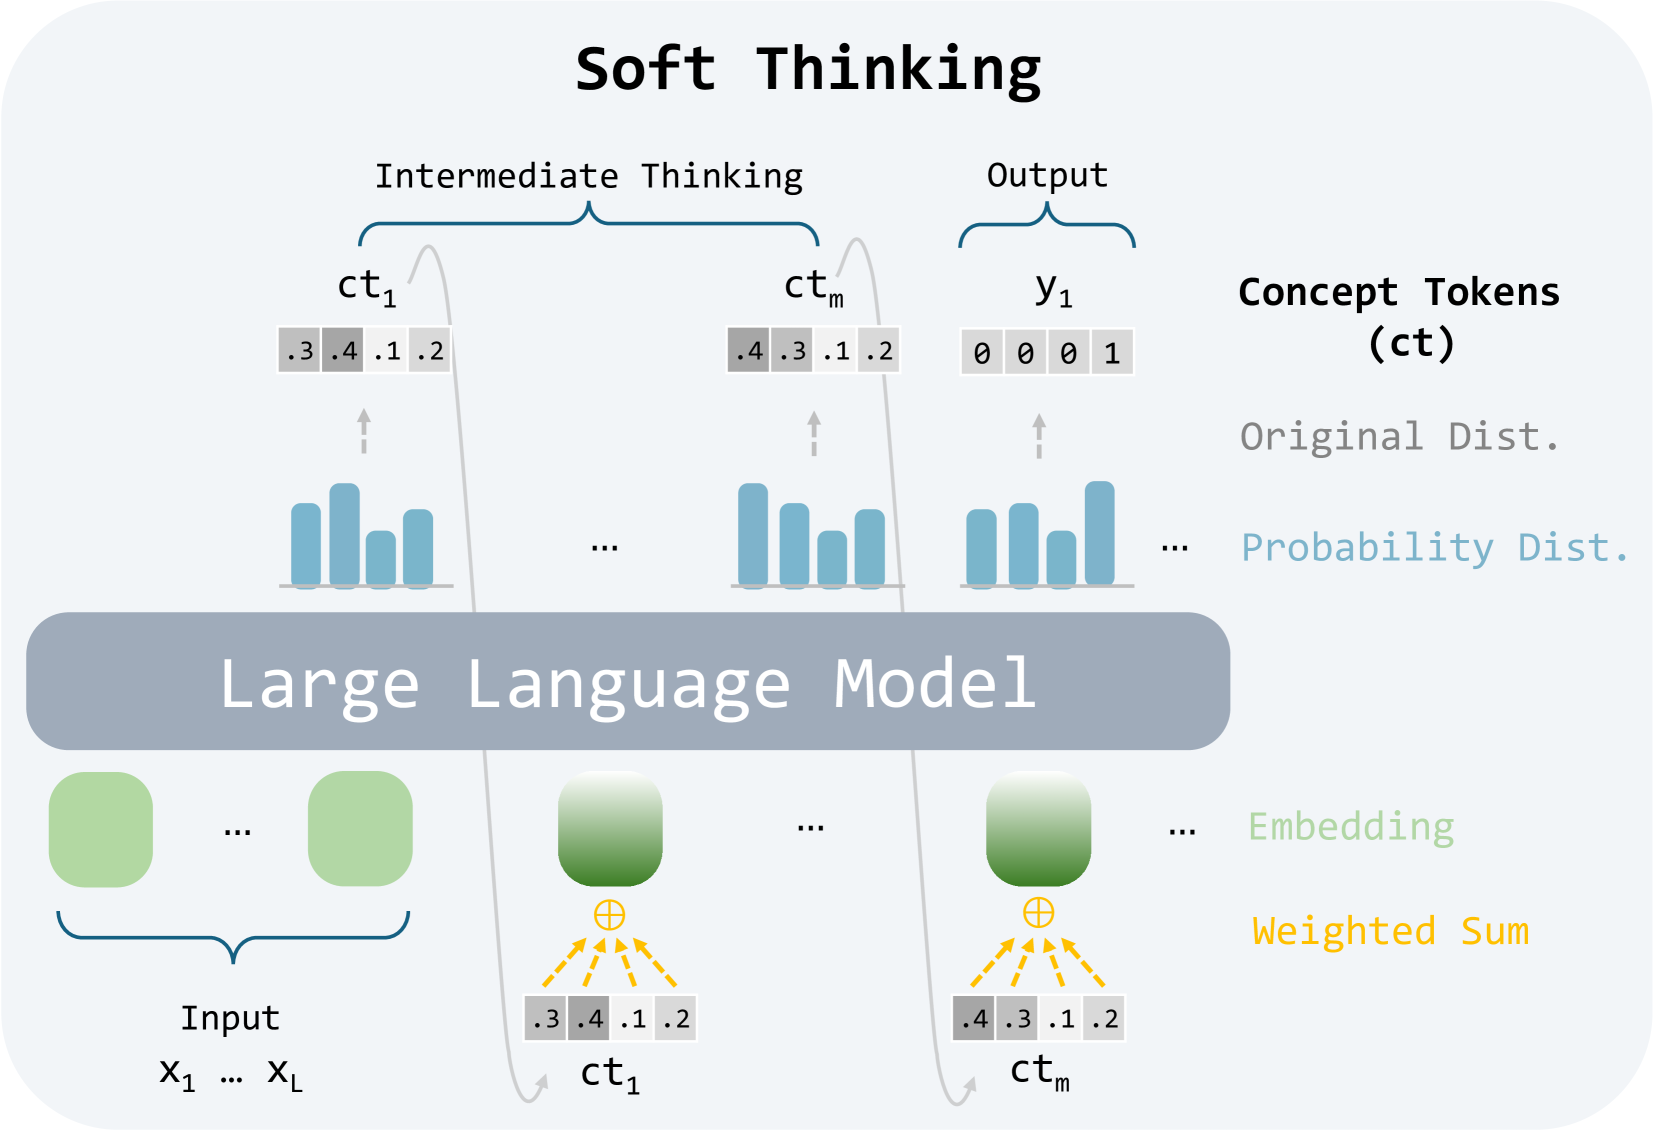
The image is a technical diagram illustrating a conceptual framework called "Soft Thinking." It depicts how a Large Language Model (LLM) processes input data through intermediate, probabilistic "concept tokens" to generate a final output. The diagram emphasizes a continuous, weighted-sum approach rather than discrete, hard token selection.
### Components/Axes
The diagram is structured into three horizontal layers, with a legend on the right side.
**Top Layer (Output & Intermediate Thinking):**
* **Title:** "Soft Thinking" (centered at the top).
* **Sections:**
* **Intermediate Thinking:** A bracket encompasses two elements labeled `ct₁` and `ctₘ`.
* **Output:** A bracket encompasses one element labeled `y₁`.
* **Elements:**
* `ct₁`: A row of four grey boxes containing the numbers `.3`, `.4`, `.1`, `.2`.
* `ctₘ`: A row of four grey boxes containing the numbers `.4`, `.3`, `.1`, `.2`.
* `y₁`: A row of four grey boxes containing the numbers `0`, `0`, `0`, `1`.
* **Visualizations:** Below each `ct` and `y₁` label is a small bar chart (blue bars) representing a probability distribution. An upward-pointing arrow connects each bar chart to its corresponding row of numbers above.
**Middle Layer (Core Model):**
* A large, grey, rounded rectangle labeled **"Large Language Model"** spans the width of the diagram.
**Bottom Layer (Input & Processing):**
* **Left Side (Input):**
* A bracket labeled **"Input"** encompasses two green rounded rectangles.
* Below the bracket, the text reads `x₁ ... x_L`.
* **Right Side (Processing):**
* Two green rounded rectangles are shown, each with a yellow circle containing a plus sign (`⊕`) below it.
* From each `⊕` symbol, multiple yellow dashed arrows point downward to a row of grey boxes.
* The first set of boxes contains `.3`, `.4`, `.1`, `.2` and is labeled `ct₁`.
* The second set of boxes contains `.4`, `.3`, `.1`, `.2` and is labeled `ctₘ`.
* A curved grey arrow points from the `ct₁` boxes at the bottom up to the `ct₁` boxes in the top layer. A similar arrow connects the bottom `ctₘ` to the top `ctₘ`.
**Legend (Right Side):**
* **Title:** **"Concept Tokens (ct)"**
* **Color/Text Key:**
* **Grey text:** "Original Dist." (corresponds to the grey boxes with numbers).
* **Blue text:** "Probability Dist." (corresponds to the blue bar charts).
* **Green text:** "Embedding" (corresponds to the green rounded rectangles).
* **Yellow text:** "Weighted Sum" (corresponds to the yellow `⊕` symbol and dashed arrows).
### Detailed Analysis
The diagram describes a specific computational flow:
1. **Input:** The process begins with an input sequence denoted as `x₁ ... x_L`. These are represented as green "Embedding" blocks.
2. **Intermediate Processing (Soft Thinking):** The LLM does not immediately produce a final token. Instead, it generates a series of intermediate "Concept Tokens" (`ct₁` through `ctₘ`).
* Each concept token is a **probability distribution** over a vocabulary (visualized as blue bar charts).
* This distribution is represented numerically as a set of weights (e.g., `ct₁ = [.3, .4, .1, .2]`). The sum of these weights is 1.0.
* The diagram shows a **"Weighted Sum"** operation (yellow `⊕`) being applied to the embeddings to produce these concept token distributions.
3. **Output Generation:** After the intermediate thinking steps, a final output `y₁` is produced.
* The output `y₁` is shown as `[0, 0, 0, 1]`, which is a one-hot encoded vector. This represents a discrete, hard selection of the fourth token in the vocabulary.
* This output also has an associated probability distribution (blue bar chart), which in this case shows a single high bar for the selected token.
### Key Observations
* **Soft vs. Hard:** The core concept is the use of "soft," probabilistic concept tokens (`ct`) during intermediate steps, contrasted with the "hard," one-hot encoded final output (`y`).
* **Flow Direction:** The primary data flow is upward: from Input Embeddings → through the LLM → to Intermediate Concept Tokens → to Final Output. A secondary flow shows the weighted sum operation feeding into the concept tokens.
* **Numerical Consistency:** The numerical values for `ct₁` (`.3, .4, .1, .2`) and `ctₘ` (`.4, .3, .1, .2`) are identical in both the top (output of LLM) and bottom (input via weighted sum) layers, indicating these are the same tokens being referenced.
* **Vocabulary Size:** The four boxes in each token row suggest a simplified vocabulary size of 4 for this illustration.
### Interpretation
This diagram illustrates a **"Soft Thinking"** or **"Chain-of-Thought"** paradigm for LLMs, where the model engages in a continuous, internal reasoning process before committing to a discrete output.
* **What it demonstrates:** It proposes that instead of jumping directly from input to a single output token, the model can benefit from generating intermediate, probabilistic representations (concept tokens). These act as "thought steps" that capture uncertainty and multiple possibilities.
* **Relationships:** The LLM is the central processor that transforms input embeddings into these soft concept tokens via a weighted sum mechanism. The final output is a discretized version of the last concept token.
* **Significance:** This approach could allow for more nuanced reasoning, better handling of ambiguity, and potentially more interpretable model behavior, as the intermediate probability distributions (`ct`) reveal the model's confidence and alternative considerations at each step. The final one-hot output (`y`) represents the model's ultimate decision after this "soft" deliberation process.