## Diagram: Soft Thinking Process
### Overview
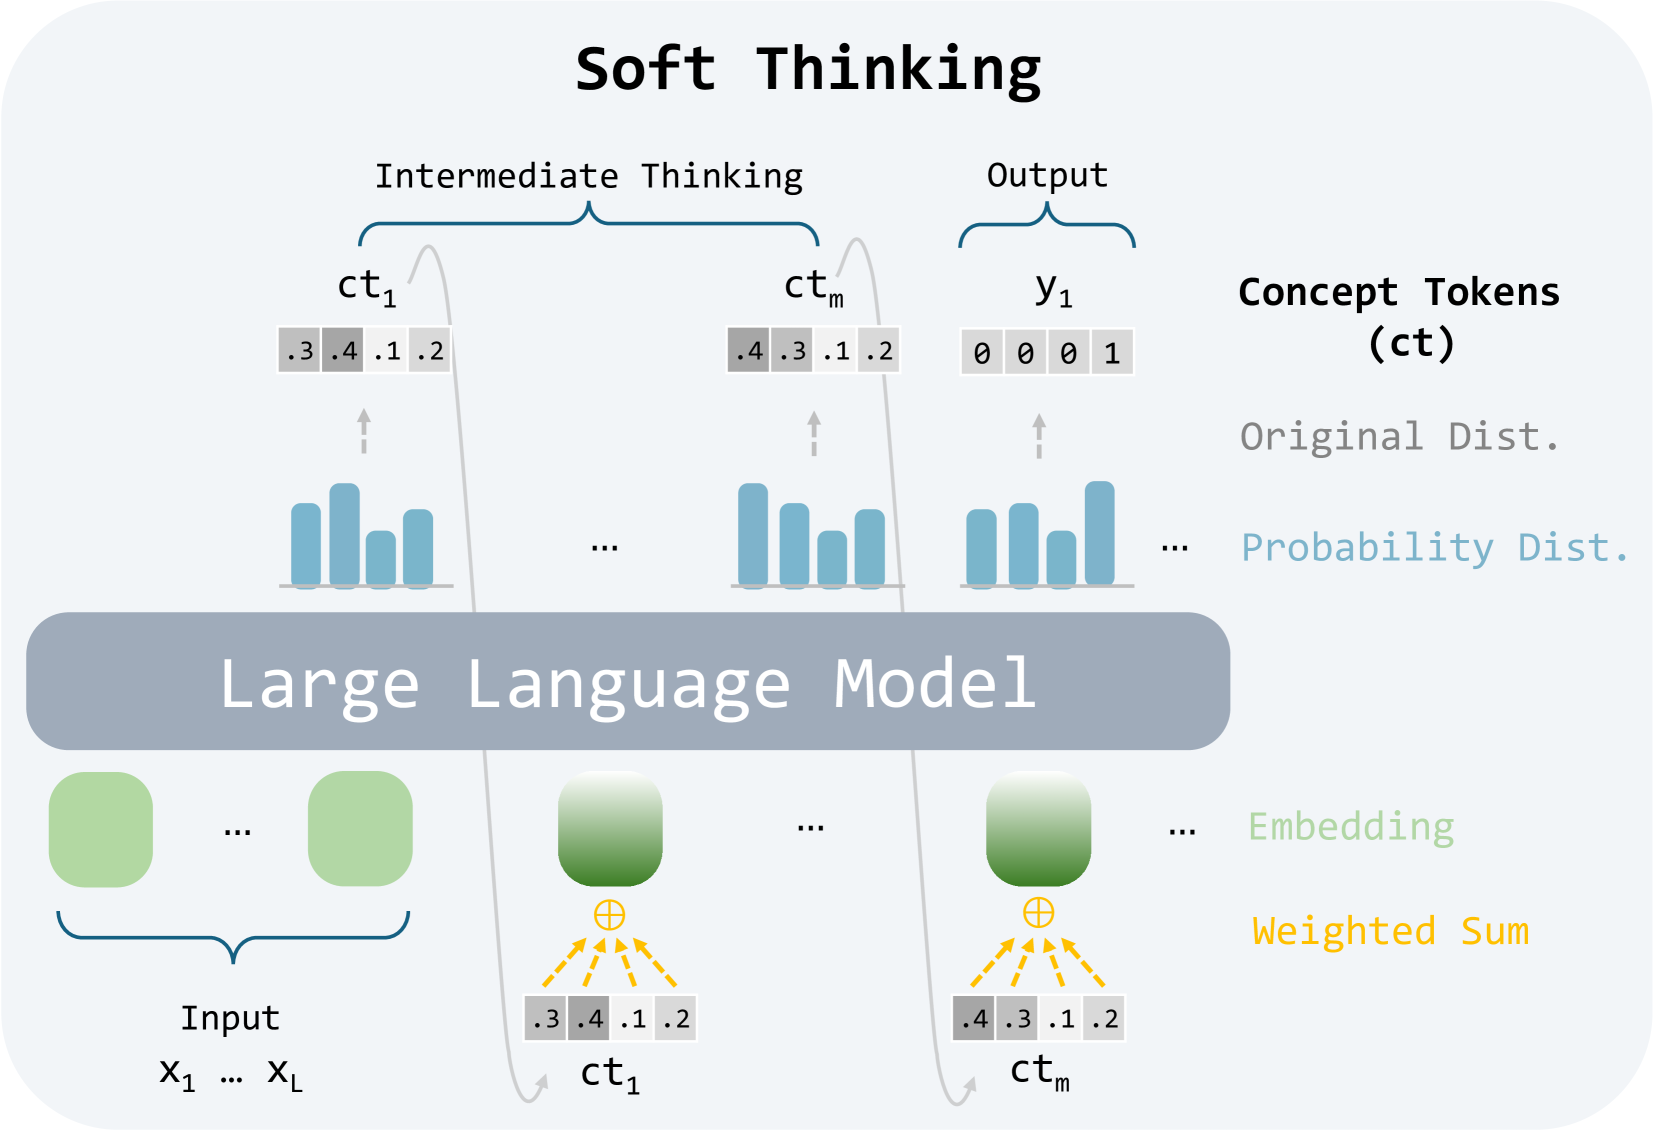
The diagram illustrates a conceptual framework for "Soft Thinking" in a large language model (LLM), showing how input data is processed through intermediate concept tokens (ct) to produce an output. Key components include input data, concept tokens, distributions, embeddings, and a weighted sum mechanism.
### Components/Axes
1. **Input**: Labeled as "Input" with sub-components X₁ to Xₗ (representing a sequence of input data points).
2. **Intermediate Thinking**:
- Contains concept tokens (ct₁ to ctₘ) with numerical values (e.g., 0.3, 0.4, 0.1, 0.2).
- Visualized as bar charts under "Original Dist." (gray) and "Probability Dist." (blue).
3. **Output**:
- Labeled "Output" with binary values (e.g., 0 0 0 1).
- Associated with "Probability Dist." bars.
4. **Concept Tokens (ct)**:
- Represented as gray rectangles with numerical values.
- Linked to embeddings via yellow arrows.
5. **Embedding**:
- Green squares with yellow arrows pointing to concept tokens.
- Labeled "Weighted Sum" (yellow).
6. **Distributions**:
- "Original Dist." (gray bars) and "Probability Dist." (blue bars) for concept tokens.
7. **Flow**:
- Input → Embedding → Concept Tokens → Intermediate Thinking → Output.
### Detailed Analysis
- **Concept Tokens**:
- ct₁: [0.3, 0.4, 0.1, 0.2] (original distribution).
- ctₘ: [0.4, 0.3, 0.1, 0.2] (probability distribution).
- **Output**:
- Binary sequence [0, 0, 0, 1] with a probability distribution favoring "1".
- **Embeddings**:
- Green squares with yellow arrows indicate transformation from concept tokens to embeddings.
- **Weighted Sum**:
- Yellow arrows and labels suggest aggregation of embeddings into a final output.
### Key Observations
1. **Token Value Shifts**:
- ct₁ and ctₘ show slight reordering of probabilities (e.g., 0.4 moves from second to first position).
2. **Output Bias**:
- Probability distribution for output strongly favors "1" (tallest bar).
3. **Embedding Mechanism**:
- Yellow arrows imply a non-linear transformation from tokens to embeddings.
### Interpretation
The diagram suggests a probabilistic reasoning process where:
- **Input data** is embedded into concept tokens, which are probabilistically refined during intermediate thinking.
- **Concept tokens** represent intermediate states with uncertainty (original vs. probability distributions).
- **Weighted sums** of embeddings produce a final output, indicating a mechanism for aggregating probabilistic information into a deterministic result.
- The model likely handles uncertainty by maintaining multiple hypotheses (via distributions) before collapsing to a final output, aligning with "soft thinking" principles.
*Note: No explicit numerical trends or anomalies are present beyond the described distributions and token values.*