## Grayscale Stripe Pattern
### Overview
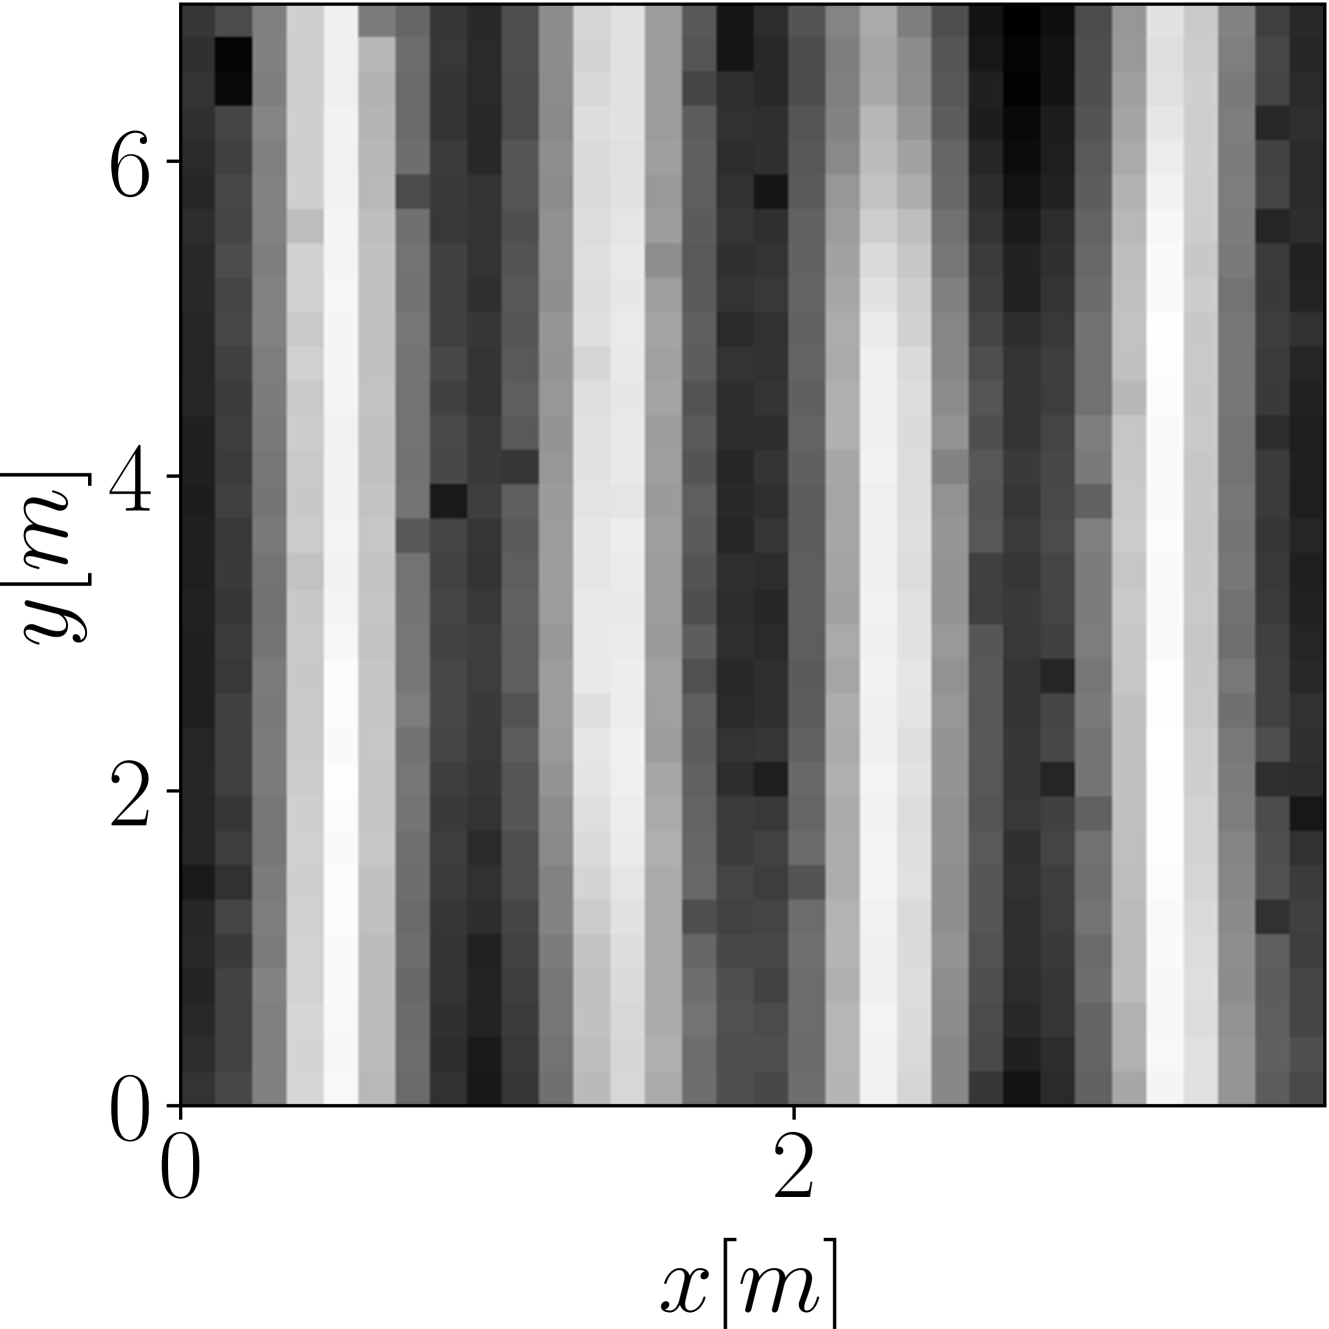
The image is a grayscale representation of a stripe pattern. The pattern consists of alternating light and dark vertical bands. The image is pixelated, suggesting it may be a visualization of data or a low-resolution image.
### Components/Axes
* **X-axis:** Labeled as "x [m]". The axis ranges from 0 to 2.
* **Y-axis:** Labeled as "y [m]". The axis ranges from 0 to 6.
* **Grayscale:** The intensity of each pixel represents a value, with darker shades representing lower values and lighter shades representing higher values.
### Detailed Analysis
The image shows a series of vertical stripes. The stripes alternate between light and dark shades of gray. The stripes appear to be roughly uniform in width. The pixelation is noticeable, giving the image a blocky appearance.
* **X-axis:** The x-axis ranges from 0 to 2, with no intermediate markings.
* **Y-axis:** The y-axis ranges from 0 to 6, with markings at every integer value (0, 2, 4, 6).
The stripes appear to be oriented vertically, with their edges parallel to the y-axis. The width of each stripe is approximately 0.25 units on the x-axis.
### Key Observations
* The image displays a periodic pattern of alternating light and dark vertical stripes.
* The pixelation suggests a discrete representation of the data.
* The x and y axes are labeled with units of meters (m).
### Interpretation
The image likely represents a spatial distribution of some quantity, where the intensity of the grayscale corresponds to the magnitude of the quantity. The periodic stripe pattern suggests a wave-like phenomenon or a structured arrangement of materials. The pixelation indicates that the data is either sampled or inherently discrete. The axes provide a spatial context, indicating that the pattern exists within a 2x6 meter area. The image could represent, for example, the intensity of light in an interference pattern, or the density of a material in a layered structure.