## Heatmap: Unlabeled Grayscale Data Matrix
### Overview
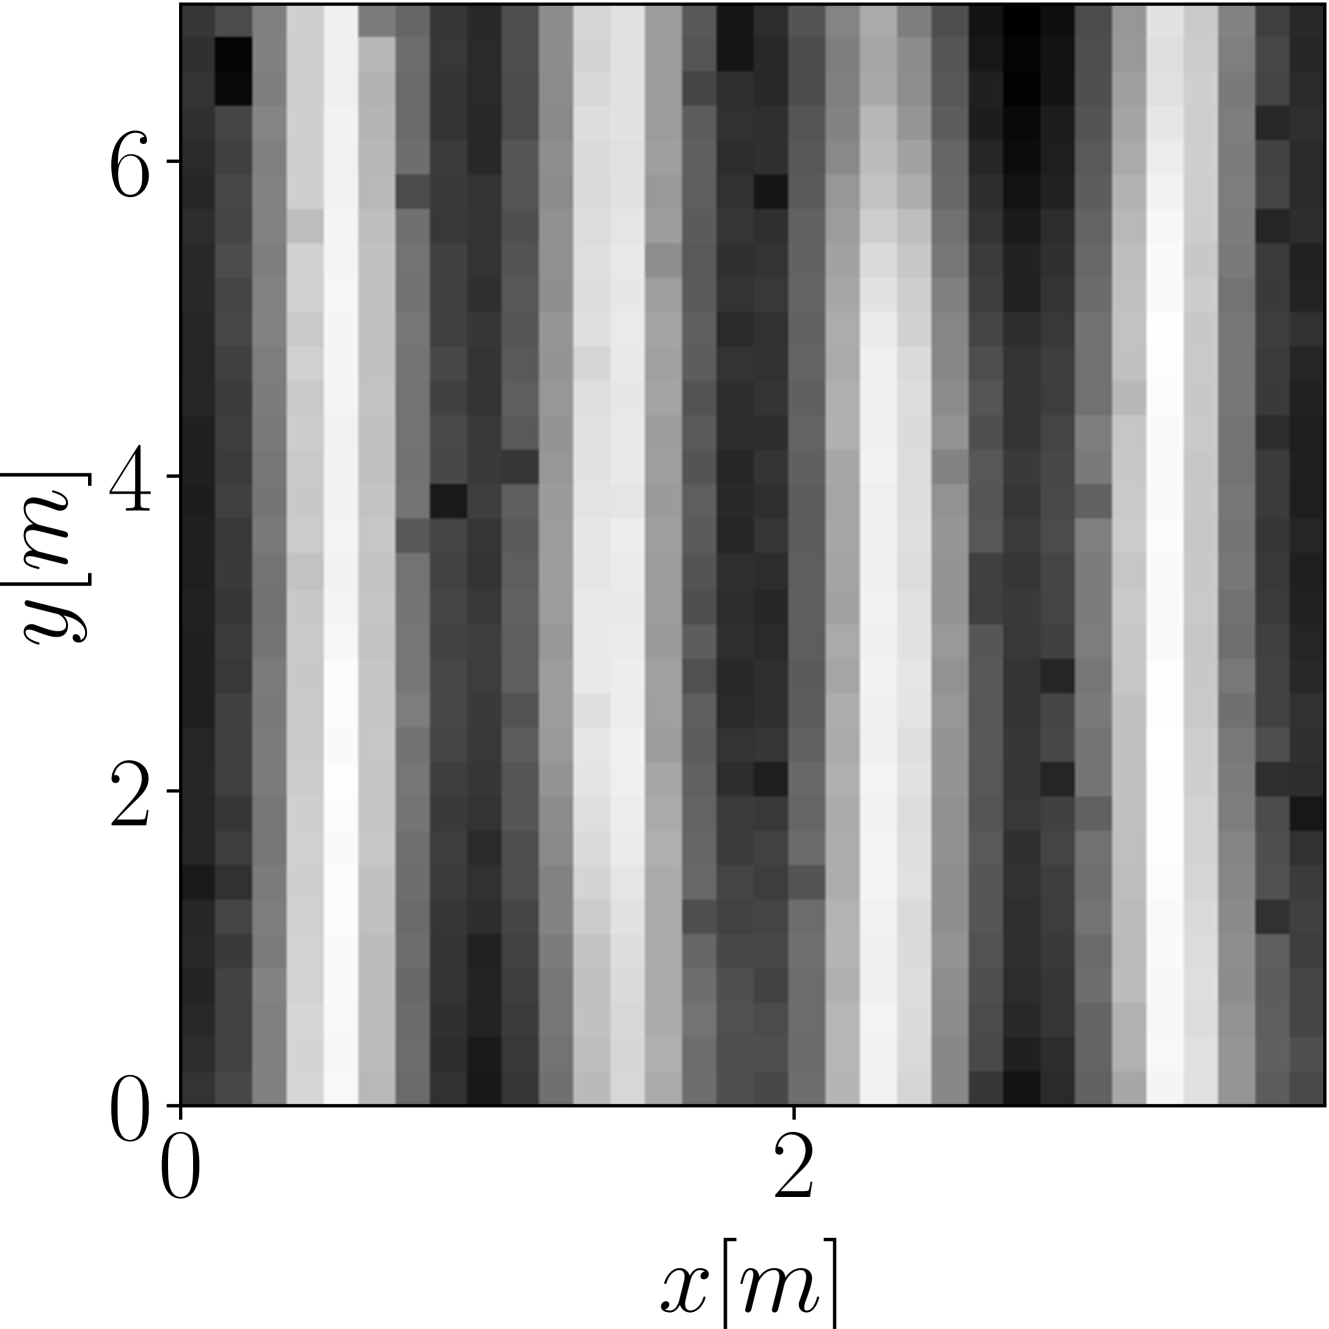
The image depicts a grayscale heatmap with a grid structure, where intensity variations (from black to white) represent data values. Axes are labeled `x[m]` (horizontal) and `y[m]` (vertical), both ranging from 0 to 6. No legend or colorbar is present to quantify exact values.
### Components/Axes
- **X-axis (`x[m]`)**: Labeled in meters, spanning 0 to 6 with evenly spaced tick marks.
- **Y-axis (`y[m]`)**: Labeled in meters, spanning 0 to 6 with evenly spaced tick marks.
- **Grid**: A matrix of cells formed by intersecting vertical and horizontal grid lines.
- **Color Gradient**: Shades range from black (lowest intensity) to white (highest intensity), with intermediate grays.
### Detailed Analysis
- **Vertical Stripes**: Alternating dark and light vertical bands dominate the heatmap, suggesting periodic or segmented data patterns.
- **Horizontal Stripes**: Subtle horizontal variations exist within vertical bands, indicating localized intensity changes.
- **Outliers**: Small black squares (e.g., at `x ≈ 1.5`, `y ≈ 3` and `x ≈ 4.5`, `y ≈ 5`) disrupt the stripe patterns, possibly representing missing data or anomalies.
- **Resolution**: Pixelation is visible, implying discrete data points or low-resolution sampling.
### Key Observations
1. **Periodic Patterns**: Vertical bands repeat approximately every 1–2 meters, hinting at cyclical or structured data.
2. **Anomalies**: Black squares are isolated and do not follow the stripe pattern, suggesting outliers or errors.
3. **Ambiguity**: Without a colorbar, exact intensity values cannot be determined—only relative differences are observable.
### Interpretation
The heatmap likely represents a structured dataset with spatial or temporal periodicity (e.g., wave interference, sensor grid data). The vertical stripes may correspond to repeating phenomena, while horizontal variations could indicate localized effects. The black squares may represent sensor failures, data gaps, or intentional masking. The absence of a colorbar limits quantitative analysis, but the grayscale gradient suggests a continuous variable (e.g., pressure, temperature, or signal strength). Further context (e.g., data source, units) is required to validate hypotheses.