## Flow Diagram: System Control Loop
### Overview
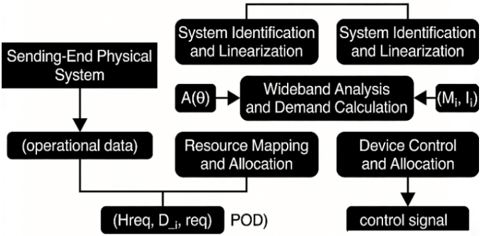
The image is a flow diagram illustrating a system control loop. It depicts the flow of information and processes from a "Sending-End Physical System" through various stages of analysis, resource allocation, and control, ultimately resulting in a "control signal."
### Components/Axes
The diagram consists of several rectangular blocks representing different processes or data points, connected by arrows indicating the flow of information. The blocks are labeled as follows:
* **Sending-End Physical System:** Located at the top-left of the diagram.
* **(operational data):** Located below the "Sending-End Physical System."
* **System Identification and Linearization:** Located at the top-center and top-right of the diagram.
* **A(Θ):** Located to the left of "Wideband Analysis and Demand Calculation."
* **Wideband Analysis and Demand Calculation:** Located in the center of the diagram.
* **(M₁, I₁):** Located to the right of "Wideband Analysis and Demand Calculation."
* **Resource Mapping and Allocation:** Located below "Wideband Analysis and Demand Calculation" and to the left.
* **Device Control and Allocation:** Located below "Wideband Analysis and Demand Calculation" and to the right.
* **(Hreq, D-j, req) POD):** Located below "Resource Mapping and Allocation."
* **control signal:** Located at the bottom-right of the diagram.
### Detailed Analysis or ### Content Details
1. **Sending-End Physical System:** The process begins with the "Sending-End Physical System," which generates "(operational data)."
2. **(operational data):** The operational data flows downwards.
3. **Data Flow Split:** The operational data splits into two paths. One path leads to "(Hreq, D-j, req) POD)," and the other path is not explicitly connected to any other block.
4. **System Identification and Linearization:** The "Wideband Analysis and Demand Calculation" block receives input from two "System Identification and Linearization" blocks located at the top-center and top-right.
5. **Wideband Analysis and Demand Calculation:** This block receives inputs "A(Θ)" and "(M₁, I₁)."
6. **Resource Mapping and Allocation & Device Control and Allocation:** The "Wideband Analysis and Demand Calculation" block outputs to both "Resource Mapping and Allocation" and "Device Control and Allocation."
7. **Final Output:** "Device Control and Allocation" outputs a "control signal."
### Key Observations
* The diagram illustrates a closed-loop control system.
* The "Wideband Analysis and Demand Calculation" block acts as a central processing unit, receiving inputs from multiple sources and distributing outputs to resource mapping and device control.
* The diagram lacks specific details about the nature of the data and processes involved, focusing on the overall flow of information.
### Interpretation
The flow diagram represents a system designed to control a "Sending-End Physical System." The system uses operational data, along with system identification and linearization, to perform wideband analysis and demand calculation. This analysis informs resource mapping and device control, ultimately generating a control signal to influence the physical system. The diagram highlights the interconnectedness of various components in achieving a desired control outcome. The presence of feedback loops (implied by the "System Identification and Linearization" blocks feeding into the "Wideband Analysis" block) suggests a dynamic and adaptive control mechanism.