## Flowchart: System Operational and Control Process
### Overview
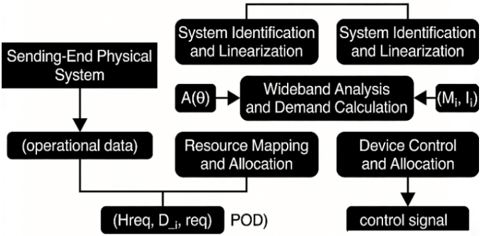
The diagram illustrates a technical system workflow involving data acquisition, processing, resource allocation, and control signal generation. It depicts bidirectional data flows between physical systems, operational data, and computational processes, with feedback loops and parallel processing paths.
### Components/Axes
1. **Main Components**:
- Sending-End Physical System
- Operational Data (Hreq, D_i, req)
- System Identification and Linearization (A(θ))
- Wideband Analysis and Demand Calculation (M_i, I_i)
- Resource Mapping and Allocation
- Device Control and Allocation
- Control Signal
- POD (Proof of Delivery)
2. **Data Flows**:
- Arrows indicate sequential processing (e.g., "Sending-End Physical System" → "Operational Data")
- Dashed lines suggest optional or parallel processing paths
- Bidirectional feedback between "Wideband Analysis" and "System Identification"
### Detailed Analysis
1. **Left Pathway**:
- **Sending-End Physical System** → **Operational Data** (Hreq, D_i, req)
- **Operational Data** branches to:
- **Resource Mapping and Allocation**
- **POD** (Hreq, D_i, req)
2. **Right Pathway**:
- **System Identification and Linearization** (A(θ)) → **Wideband Analysis and Demand Calculation** (M_i, I_i)
- **Wideband Analysis** feeds back to **System Identification**
- **Wideband Analysis** → **Device Control and Allocation** → **Control Signal**
3. **Key Parameters**:
- **A(θ)**: System identification function with angular parameter θ
- **M_i, I_i**: Outputs from wideband analysis (likely matrix and intensity metrics)
- **Hreq, D_i, req**: Operational data inputs for POD
### Key Observations
1. **Parallel Processing**: Operational data splits into two streams (resource allocation vs. POD)
2. **Feedback Loop**: Wideband analysis iteratively refines system identification
3. **Control Signal Generation**: Final output depends on both resource allocation and device control processes
4. **Bidirectional Dependency**: System identification and wideband analysis form a closed-loop optimization system
### Interpretation
This diagram represents a closed-loop control system for managing physical infrastructure (e.g., power grids, communication networks). The system:
1. Acquires real-time operational data from physical endpoints
2. Uses system identification to model physical characteristics (A(θ))
3. Performs wideband analysis to calculate demand metrics (M_i, I_i)
4. Allocates resources based on both operational needs (POD) and demand calculations
5. Generates control signals through device-level allocation
The bidirectional feedback between system identification and wideband analysis suggests an adaptive optimization process, where demand calculations continuously refine system models. The parallel processing of operational data indicates the system handles multiple objectives simultaneously: immediate resource needs (POD) and long-term demand planning (wideband analysis).
Notably, the absence of explicit time-series data suggests this is a static process model rather than a dynamic simulation. The use of matrix notation (M_i) implies complex, multidimensional data processing in the wideband analysis stage.