\n
## Diagram: Abstract Grid Arrangement
### Overview
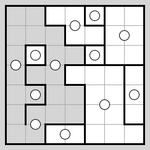
The image presents a square grid composed of smaller rectangular and square regions, some filled with gray shading, others left white. Within these regions are several circles. The arrangement appears to be a puzzle or a visual representation of a spatial problem. There are no explicit labels or axes.
### Components/Axes
The image consists of:
* A square grid, approximately 7x7 cells.
* Rectangular and square regions of varying sizes within the grid.
* Gray shaded regions.
* White regions.
* Circles placed within some of the white regions.
* A black border around the entire grid.
### Detailed Analysis or Content Details
The grid is divided into several regions. The circles are positioned as follows:
* Row 1: One circle in column 5.
* Row 2: One circle in column 3, one in column 6.
* Row 3: One circle in column 2, one in column 4.
* Row 4: One circle in column 1, one in column 5.
* Row 5: One circle in column 3.
* Row 6: One circle in column 4.
* Row 7: One circle in column 2, one in column 6.
The gray shaded regions occupy approximately 40% of the grid area. They are irregularly shaped and do not follow a consistent pattern. The white regions are also irregularly shaped, forming the spaces where the circles are located.
### Key Observations
* The circles are not uniformly distributed across the grid.
* There is no apparent numerical data or scale.
* The arrangement of gray and white regions is complex and non-repetitive.
* The circles are always contained within the white regions.
### Interpretation
The image likely represents a spatial reasoning puzzle or a visual problem. The arrangement of the gray and white regions, along with the placement of the circles, could be part of a larger pattern or a set of constraints. Without additional context, it is difficult to determine the specific objective or meaning of the diagram. It could be a simplified representation of a maze, a network, or a resource allocation problem. The lack of labels or numerical data suggests that the focus is on visual relationships and spatial understanding rather than quantitative analysis. The image is a static representation, and does not suggest any dynamic process or change over time. It is a visual problem that requires spatial reasoning to solve.