## Chart: Throughput vs. Simulation Time and Empirical Distribution vs. Packet Delay
### Overview
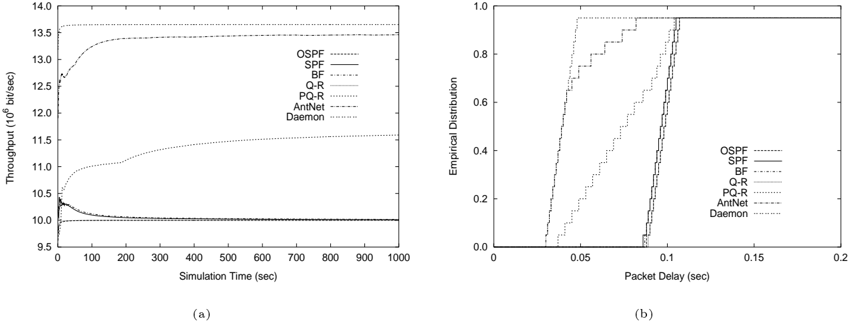
The image contains two line charts comparing different routing algorithms. Chart (a) shows the throughput (in 10^6 bit/sec) of various algorithms over simulation time (in seconds). Chart (b) shows the empirical distribution of packet delay (in seconds) for the same algorithms.
### Components/Axes
**Chart (a): Throughput vs. Simulation Time**
* **X-axis:** Simulation Time (sec)
* Scale: 0 to 1000, with major ticks at intervals of 100.
* **Y-axis:** Throughput (10^6 bit/sec)
* Scale: 9.5 to 14.0, with major ticks at intervals of 0.5.
* **Legend (Top-Right):**
* OSPF: Dashed line
* SPF: Solid line
* BF: Dotted line
* Q-R: Dash-dot line
* PQ-R: Gray solid line
* AntNet: Dashed line with wider dashes
* Daemon: Dotted line with wider dots
**Chart (b): Empirical Distribution vs. Packet Delay**
* **X-axis:** Packet Delay (sec)
* Scale: 0 to 0.2, with major ticks at intervals of 0.05.
* **Y-axis:** Empirical Distribution
* Scale: 0.0 to 1.0, with major ticks at intervals of 0.2.
* **Legend (Center-Right):**
* OSPF: Dashed line
* SPF: Solid line
* BF: Dotted line
* Q-R: Dash-dot line
* PQ-R: Gray solid line
* AntNet: Dashed line with wider dashes
* Daemon: Dotted line with wider dots
### Detailed Analysis
**Chart (a): Throughput vs. Simulation Time**
* **OSPF (Dashed line):** Starts at approximately 10.3, dips slightly below 10, and then stabilizes around 10.0.
* **SPF (Solid line):** Starts at approximately 10.3, dips slightly below 10, and then stabilizes around 10.0.
* **BF (Dotted line):** Starts at approximately 10.3, dips slightly below 10, and then stabilizes around 10.0.
* **Q-R (Dash-dot line):** Starts at approximately 10.3, dips slightly below 10, and then stabilizes around 10.0.
* **PQ-R (Gray solid line):** Starts at approximately 10.7, rises to approximately 11.5, and stabilizes around 11.5.
* **AntNet (Dashed line with wider dashes):** Starts at approximately 12.7, rises to approximately 13.4, and stabilizes around 13.4.
* **Daemon (Dotted line with wider dots):** Starts at approximately 9.8, rises to approximately 13.7, and stabilizes around 13.7.
**Chart (b): Empirical Distribution vs. Packet Delay**
* **OSPF (Dashed line):** Rises sharply from 0 to 1 between approximately 0.08 and 0.1.
* **SPF (Solid line):** Rises sharply from 0 to 1 between approximately 0.08 and 0.1.
* **BF (Dotted line):** Rises sharply from 0 to 1 between approximately 0.08 and 0.1.
* **Q-R (Dash-dot line):** Rises sharply from 0 to 1 between approximately 0.08 and 0.1.
* **PQ-R (Gray solid line):** Rises sharply from 0 to 1 between approximately 0.06 and 0.08.
* **AntNet (Dashed line with wider dashes):** Rises gradually from 0 to 1 between approximately 0.02 and 0.06.
* **Daemon (Dotted line with wider dots):** Rises gradually from 0 to 1 between approximately 0.01 and 0.05.
### Key Observations
* In Chart (a), OSPF, SPF, BF, and Q-R have similar and relatively low throughput, stabilizing around 10.0 (10^6 bit/sec). PQ-R has a higher throughput, stabilizing around 11.5 (10^6 bit/sec). AntNet and Daemon have the highest throughput, stabilizing around 13.4 and 13.7 (10^6 bit/sec) respectively.
* In Chart (b), OSPF, SPF, BF, and Q-R have similar packet delay distributions, with a sharp rise around 0.08-0.1 seconds. PQ-R has a slightly lower packet delay, with a sharp rise around 0.06-0.08 seconds. AntNet and Daemon have significantly lower packet delays, with gradual rises between 0.01-0.06 seconds.
### Interpretation
The data suggests that AntNet and Daemon algorithms provide the best performance in terms of both throughput and packet delay. OSPF, SPF, BF, and Q-R have similar, lower performance. PQ-R offers a moderate improvement over the latter group. The relationship between the charts shows that algorithms with higher throughput tend to have lower packet delay, which is expected. The notable outliers are AntNet and Daemon, which significantly outperform the other algorithms in both metrics.