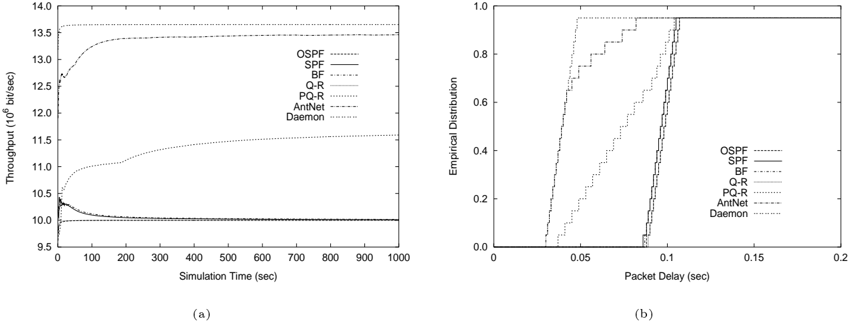
\n
## Charts: Throughput vs. Simulation Time & Empirical Distribution of Packet Delay
### Overview
The image presents two charts side-by-side. Chart (a) depicts throughput (in 10^6 bits/sec) as a function of simulation time (in seconds) for six different routing protocols. Chart (b) shows the empirical distribution of packet delay (in seconds) for the same six protocols. Both charts are line graphs.
### Components/Axes
**Chart (a): Throughput vs. Simulation Time**
* **X-axis:** Simulation Time (sec), ranging from 0 to 1000, with markers at 0, 100, 200, 300, 400, 500, 600, 700, 800, 900, and 1000.
* **Y-axis:** Throughput (10^6 bit/sec), ranging from 9.5 to 14.0, with markers at 9.5, 10.0, 10.5, 11.0, 11.5, 12.0, 12.5, 13.0, 13.5, and 14.0.
* **Legend (top-right):**
* OSPF (dashed line)
* SPF (dotted line)
* BF (dashed-dotted line)
* Q-R (dashed line)
* PQ-R (dotted line)
* AntNet (dashed-dotted line)
* Daemon (solid line)
**Chart (b): Empirical Distribution of Packet Delay**
* **X-axis:** Packet Delay (sec), ranging from 0.0 to 0.2, with markers at 0.0, 0.05, 0.10, 0.15, and 0.20.
* **Y-axis:** Empirical Distribution, ranging from 0.0 to 1.0, with markers at 0.0, 0.2, 0.4, 0.6, 0.8, and 1.0.
* **Legend (top-right):**
* OSPF (dashed line)
* SPF (dotted line)
* BF (dashed-dotted line)
* Q-R (dashed line)
* PQ-R (dotted line)
* AntNet (dashed-dotted line)
* Daemon (solid line)
### Detailed Analysis or Content Details
**Chart (a): Throughput vs. Simulation Time**
* **Daemon:** Starts at approximately 9.8 x 10^6 bits/sec at time 0, and remains relatively constant at approximately 9.9 x 10^6 bits/sec throughout the simulation.
* **AntNet:** Starts at approximately 10.1 x 10^6 bits/sec at time 0, and remains relatively constant at approximately 10.2 x 10^6 bits/sec throughout the simulation.
* **PQ-R:** Starts at approximately 10.2 x 10^6 bits/sec at time 0, and remains relatively constant at approximately 10.3 x 10^6 bits/sec throughout the simulation.
* **Q-R:** Starts at approximately 10.2 x 10^6 bits/sec at time 0, and remains relatively constant at approximately 10.3 x 10^6 bits/sec throughout the simulation.
* **BF:** Shows a gradual increase in throughput from approximately 10.2 x 10^6 bits/sec at time 0 to approximately 10.8 x 10^6 bits/sec at time 1000.
* **SPF:** Exhibits a rapid increase in throughput from approximately 10.2 x 10^6 bits/sec at time 0 to approximately 13.2 x 10^6 bits/sec at time 100. After this initial increase, the throughput plateaus around 13.2 x 10^6 bits/sec.
* **OSPF:** Shows a similar rapid increase in throughput as SPF, starting at approximately 10.2 x 10^6 bits/sec at time 0 and reaching approximately 13.5 x 10^6 bits/sec at time 100. It then plateaus around 13.5 x 10^6 bits/sec.
**Chart (b): Empirical Distribution of Packet Delay**
* All protocols show a step-like cumulative distribution function.
* The curves are very similar, with a rapid increase in the empirical distribution from 0 to approximately 0.8 at a packet delay of around 0.05 seconds.
* The curves then plateau, reaching approximately 1.0 at a packet delay of around 0.12 seconds.
* There are minor differences in the exact shape of the curves, but they are generally clustered together.
### Key Observations
* In Chart (a), Daemon, AntNet, PQ-R, and Q-R exhibit consistently low and stable throughput.
* BF shows a slow, steady increase in throughput over time.
* SPF and OSPF demonstrate the highest throughput, with a rapid initial increase followed by a plateau.
* In Chart (b), all protocols have similar empirical distributions of packet delay, indicating comparable delay characteristics.
### Interpretation
These charts likely represent the performance of different routing protocols in a network simulation. Chart (a) demonstrates that OSPF and SPF achieve the highest throughput, suggesting they are more efficient at forwarding packets. The stable throughput of Daemon, AntNet, PQ-R, and Q-R indicates they may be suitable for applications where consistent performance is prioritized over maximum speed.
Chart (b) shows that the packet delay distributions are similar across all protocols. This suggests that, while some protocols may achieve higher throughput, they do not necessarily introduce significantly higher delays. The step-like nature of the cumulative distribution functions indicates that there are distinct delay ranges experienced by packets in the network.
The data suggests a trade-off between throughput and delay. Protocols like OSPF and SPF prioritize throughput, while others prioritize stability. The choice of protocol would depend on the specific requirements of the network application. The clustering of delay distributions suggests that the network topology and traffic patterns have a greater impact on delay than the routing protocol itself.