\n
## Line Graphs: Network Protocol Performance Comparison
### Overview
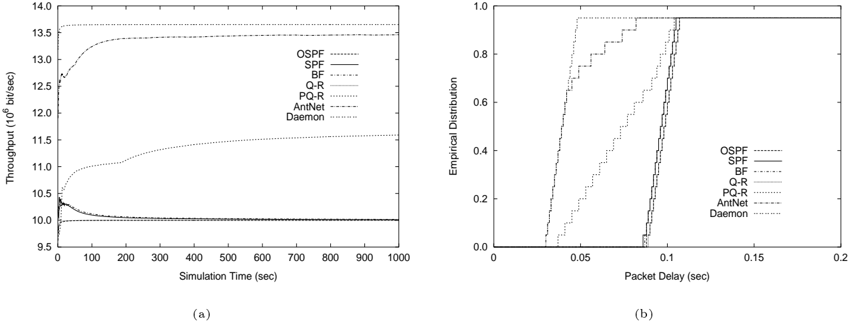
The image contains two side-by-side line charts, labeled (a) and (b), comparing the performance of seven network routing protocols over a simulation. Chart (a) plots throughput against simulation time, while chart (b) shows the empirical cumulative distribution function (CDF) of packet delay. The protocols compared are OSPF, SPF, BF, Q-R, PCAL, AntNet, and Daemon.
### Components/Axes
**Chart (a) - Left Graph:**
* **Title/Label:** (a) at the bottom center.
* **X-Axis:** "Simulation Time (sec)". Scale: 0 to 1000, with major ticks every 100 seconds.
* **Y-Axis:** "Throughput (10^6 bit/sec)". Scale: 9.5 to 14.0, with major ticks every 0.5 units.
* **Legend:** Located in the upper-right quadrant. Lists seven protocols with corresponding line styles:
* OSPF: Dashed line (`---`)
* SPF: Dotted line (`...`)
* BF: Dash-dot line (`-.-.`)
* Q-R: Solid line (`---`)
* PCAL: Dotted line (`...`) - *Note: Appears visually similar to SPF's style.*
* AntNet: Dashed line (`---`) - *Note: Appears visually similar to OSPF's style.*
* Daemon: Dash-dot line (`-.-.`) - *Note: Appears visually similar to BF's style.*
**Chart (b) - Right Graph:**
* **Title/Label:** (b) at the bottom center.
* **X-Axis:** "Packet Delay (sec)". Scale: 0 to 0.2, with major ticks every 0.05 seconds.
* **Y-Axis:** "Empirical Distribution". Scale: 0.0 to 1.0, with major ticks every 0.2 units.
* **Legend:** Located in the upper-right quadrant. Identical list of seven protocols with line styles matching those in chart (a).
### Detailed Analysis
**Chart (a) - Throughput vs. Simulation Time:**
* **Trend Verification & Data Points:**
* **OSPF (Dashed):** Starts at ~12.5, rises sharply to plateau at ~13.5 by t=100s, remains stable.
* **SPF (Dotted):** Starts at ~10.0, rises gradually to plateau at ~11.6 by t=600s, remains stable.
* **BF (Dash-dot):** Starts at ~10.3, rises sharply to plateau at ~13.7 by t=50s, remains stable. This is the highest sustained throughput.
* **Q-R (Solid):** Starts at ~10.3, drops quickly to ~10.0 by t=50s, remains stable at the lowest level.
* **PCAL (Dotted):** Starts at ~10.3, rises to ~10.5 by t=50s, then very slowly increases to ~10.6 by t=1000s.
* **AntNet (Dashed):** Starts at ~10.3, drops to ~10.0 by t=100s, remains stable, closely overlapping Q-R.
* **Daemon (Dash-dot):** Shows a unique, sharp initial spike to ~10.5 at t=0, then drops rapidly to ~10.0 by t=50s, remaining stable and overlapping Q-R and AntNet.
**Chart (b) - Empirical Distribution of Packet Delay (CDF):**
* **Trend Verification & Data Points:**
* **OSPF (Dashed):** Steepest curve. Reaches a distribution of 1.0 (100% of packets) at a delay of ~0.04 sec. Indicates consistently very low delay.
* **SPF (Dotted):** Rises steeply after 0.03 sec, reaches 1.0 at ~0.06 sec. Low delay, slightly higher than OSPF.
* **BF (Dash-dot):** Rises steeply after 0.08 sec, reaches 1.0 at ~0.10 sec. Moderate delay.
* **Q-R (Solid):** Rises steeply after 0.09 sec, reaches 1.0 at ~0.11 sec. Slightly higher delay than BF.
* **PCAL (Dotted):** Rises more gradually starting at ~0.03 sec, reaches 1.0 at ~0.11 sec. Shows a wider spread of delay values.
* **AntNet (Dashed):** Rises steeply after 0.09 sec, reaches 1.0 at ~0.11 sec. Very similar to Q-R.
* **Daemon (Dash-dot):** Rises steeply after 0.09 sec, reaches 1.0 at ~0.11 sec. Very similar to Q-R and AntNet.
### Key Observations
1. **Performance Clustering:** The protocols form distinct performance clusters. In throughput (a), BF is highest, OSPF is second, SPF is third, and the remaining four (Q-R, AntNet, Daemon, PCAL) are clustered at the bottom. In delay (b), OSPF is best (lowest delay), SPF is second, BF is third, and the remaining four are clustered with higher delay.
2. **Stability:** All protocols reach a stable performance state within the first 100-600 seconds of simulation time and maintain it.
3. **Daemon Anomaly:** The Daemon protocol exhibits a unique, brief initial spike in throughput not seen in any other protocol.
4. **Inverse Relationship:** There is a clear inverse relationship between the two charts for the top performers. BF has the highest throughput but moderate delay. OSPF has slightly lower throughput than BF but the best (lowest) delay. This suggests a potential trade-off between maximizing raw throughput and minimizing packet latency.
### Interpretation
This data demonstrates a comparative analysis of routing protocol efficiency in a simulated network environment. The charts reveal that protocol selection involves a fundamental trade-off between **throughput** (data volume successfully delivered) and **latency** (time for packet delivery).
* **BF (Bellman-Ford?)** appears optimized for **maximum data volume**, achieving the highest sustained throughput but at the cost of higher packet delay. This could be suitable for bulk data transfer applications where latency is less critical.
* **OSPF (Open Shortest Path First?)** is optimized for **low latency**, delivering packets with the fastest and most consistent delay, albeit with slightly lower overall throughput than BF. This is ideal for real-time applications like VoIP or video conferencing.
* **SPF (Shortest Path First?)** offers a middle-ground performance.
* The cluster of **Q-R, AntNet, Daemon, and PCAL** shows lower throughput and higher delay in this simulation, suggesting they may be less efficient under these specific test conditions or are designed for different network constraints (e.g., dynamic or adversarial environments) not captured by these metrics alone.
* The **Daemon** protocol's initial throughput spike could indicate an aggressive startup or route discovery phase that is not sustained.
The investigation suggests that the "best" protocol is entirely dependent on the application's priority: **throughput vs. latency**. The data provides a quantitative basis for making that engineering decision.