## Line Charts: Network Protocol Performance Analysis
### Overview
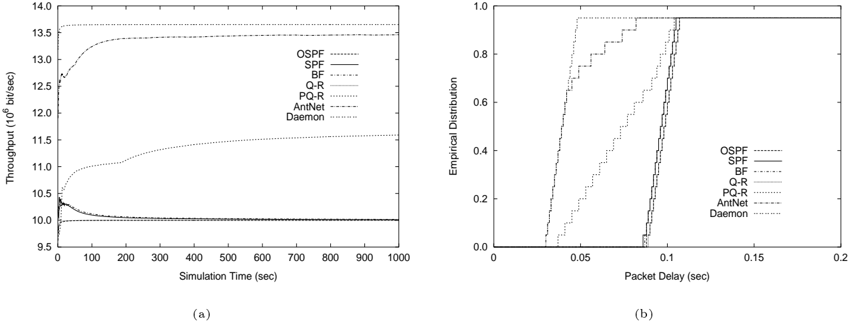
The image contains two line charts comparing network protocol performance metrics. Chart (a) shows throughput over simulation time, while chart (b) displays empirical packet delay distributions. Seven routing protocols are compared: OSPF, SPF, BF, Q-R, PQ-R, AntNet, and Daemon.
### Components/Axes
**Chart (a):**
- **X-axis**: Simulation Time (sec) [0-1000]
- **Y-axis**: Throughput (10⁶ bit/sec) [9.5-14.0]
- **Legend**: Right-aligned, lists protocols with line styles:
- OSPF: Dotted
- SPF: Solid
- BF: Dotted
- Q-R: Solid
- PQ-R: Dotted
- AntNet: Dashed
- Daemon: Dotted
**Chart (b):**
- **X-axis**: Packet Delay (sec) [0-0.2]
- **Y-axis**: Empirical Distribution [0-1.0]
- **Legend**: Right-aligned, same protocol-line style mapping as chart (a)
### Detailed Analysis
**Chart (a) Trends:**
1. **OSPF (dotted)**: Starts at ~13.5×10⁶ bit/sec, remains flat throughout
2. **SPF (solid)**: Begins at ~13.2×10⁶ bit/sec, slight upward trend to ~13.4×10⁶
3. **BF (dotted)**: Starts at ~10.2×10⁶, drops to ~9.8×10⁶ by 200s
4. **Q-R (solid)**: Begins at ~11.0×10⁶, rises to ~11.3×10⁶
5. **PQ-R (dotted)**: Starts at ~10.5×10⁶, plateaus at ~10.3×10⁶
6. **AntNet (dashed)**: Begins at ~10.1×10⁶, drops to ~9.9×10⁶
7. **Daemon (dotted)**: Starts at ~10.0×10⁶, rises to ~11.5×10⁶ by 1000s
**Chart (b) Trends:**
1. **OSPF (dotted)**: First step at ~0.05s (0.8 distribution), second at ~0.1s (0.6)
2. **SPF (solid)**: Steps at ~0.03s (0.9), ~0.07s (0.7)
3. **BF (dotted)**: Steps at ~0.04s (0.7), ~0.12s (0.5)
4. **Q-R (solid)**: Steps at ~0.06s (0.8), ~0.15s (0.6)
5. **PQ-R (dotted)**: Steps at ~0.08s (0.7), ~0.18s (0.5)
6. **AntNet (dashed)**: Steps at ~0.02s (0.9), ~0.1s (0.7)
7. **Daemon (dotted)**: Steps at ~0.1s (0.6), ~0.18s (0.4)
### Key Observations
1. **Throughput Stability**: OSPF and SPF maintain highest throughput with minimal fluctuation
2. **Daemon's Improvement**: Daemon shows significant throughput growth (100% increase) over simulation
3. **Delay Distribution**: AntNet and SPF exhibit earliest packet delivery (first steps <0.05s)
4. **Protocol Tradeoffs**: BF and AntNet show declining performance over time
### Interpretation
The data suggests OSPF and SPF protocols demonstrate optimal balance between throughput stability and low packet delay. Daemon's late-stage throughput improvement indicates potential for dynamic adaptation but suffers from initial delay penalties. The step chart reveals AntNet's aggressive early packet delivery at the cost of later performance degradation. These findings highlight protocol-specific tradeoffs between initial responsiveness and sustained performance, with OSPF/SPF emerging as most reliable performers across both metrics.