## Line Chart: Accuracy vs. Iteration for Easy and Hard Modes
### Overview
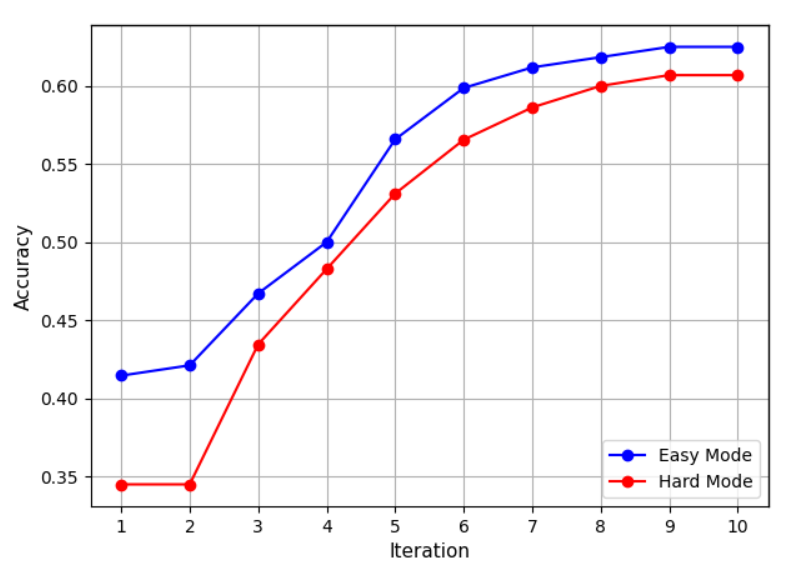
The image is a line chart comparing the accuracy of two modes ("Easy Mode" and "Hard Mode") across 10 iterations. The x-axis represents iterations (1–10), and the y-axis represents accuracy (0.35–0.60). Two lines are plotted: a blue line for "Easy Mode" and a red line for "Hard Mode," with a legend in the bottom-right corner.
### Components/Axes
- **X-axis (Iteration)**: Labeled "Iteration," with integer markers from 1 to 10.
- **Y-axis (Accuracy)**: Labeled "Accuracy," with decimal markers from 0.35 to 0.60 in increments of 0.05.
- **Legend**: Located in the bottom-right corner, with:
- Blue circle: "Easy Mode"
- Red circle: "Hard Mode"
### Detailed Analysis
#### Easy Mode (Blue Line)
- **Trend**: Steadily increases from iteration 1 to 10.
- **Data Points**:
- Iteration 1: 0.41
- Iteration 2: 0.42
- Iteration 3: 0.47
- Iteration 4: 0.50
- Iteration 5: 0.57
- Iteration 6: 0.60
- Iteration 7: 0.61
- Iteration 8: 0.62
- Iteration 9: 0.63
- Iteration 10: 0.63
#### Hard Mode (Red Line)
- **Trend**: Sharp upward trajectory after iteration 2, plateauing near iteration 9–10.
- **Data Points**:
- Iteration 1: 0.35
- Iteration 2: 0.35
- Iteration 3: 0.43
- Iteration 4: 0.48
- Iteration 5: 0.53
- Iteration 6: 0.56
- Iteration 7: 0.59
- Iteration 8: 0.60
- Iteration 9: 0.61
- Iteration 10: 0.61
### Key Observations
1. **Initial Disparity**: At iterations 1–2, "Easy Mode" starts significantly higher (0.41–0.42 vs. 0.35 for "Hard Mode").
2. **Convergence**: By iteration 10, "Hard Mode" closes the gap, achieving 0.61 accuracy vs. 0.63 for "Easy Mode."
3. **Growth Rate**: "Hard Mode" shows a steeper increase (e.g., +0.08 from iteration 4 to 5) compared to "Easy Mode" (+0.03 over the same range).
4. **Plateau**: Both modes stabilize near iteration 9–10, with minimal changes in accuracy.
### Interpretation
- **Performance Insight**: "Easy Mode" consistently outperforms "Hard Mode" across all iterations, suggesting inherent simplicity or optimization in its design. However, "Hard Mode" demonstrates significant improvement over time, indicating potential for adaptation or learning.
- **Iteration Impact**: The plateau at later iterations implies diminishing returns, where further iterations yield minimal accuracy gains. This could reflect model saturation or data exhaustion.
- **Anomaly**: The abrupt jump in "Hard Mode" accuracy at iteration 3 (from 0.35 to 0.43) suggests a critical update or algorithmic adjustment that accelerated learning.
### Spatial Grounding
- The legend is positioned in the bottom-right corner, ensuring clarity without obstructing the data.
- Data points are plotted with markers (circles) aligned to their respective lines, confirming color-legend consistency.
### Conclusion
The chart highlights a trade-off between initial performance and iterative improvement. While "Easy Mode" offers higher baseline accuracy, "Hard Mode" shows promise for scenarios requiring adaptive learning, albeit with a slower start. The convergence at later iterations underscores the value of persistence in complex systems.