\n
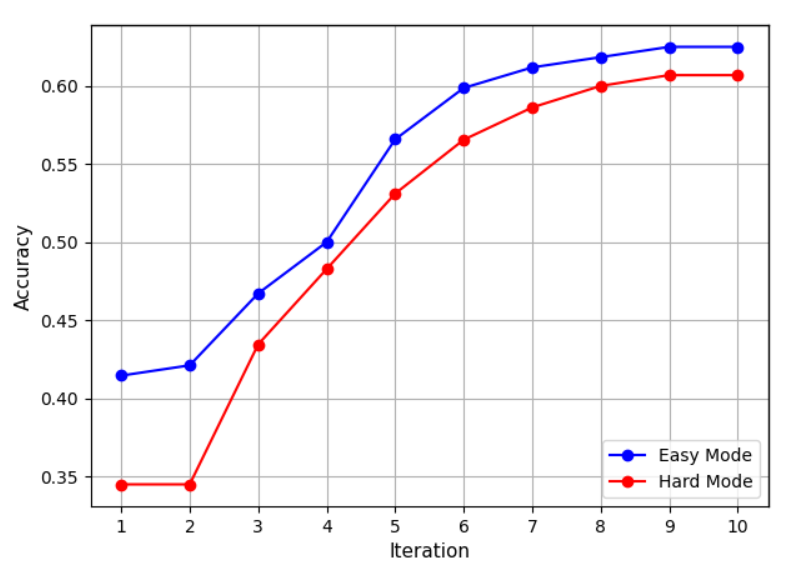
## Line Chart: Accuracy vs. Iteration for Different Modes
### Overview
This image presents a line chart illustrating the relationship between accuracy and iteration number for two different modes: "Easy Mode" and "Hard Mode". The chart displays how accuracy changes as the number of iterations increases.
### Components/Axes
* **X-axis:** Labeled "Iteration", ranging from 1 to 10. The axis is linearly scaled.
* **Y-axis:** Labeled "Accuracy", ranging from 0.35 to 0.65. The axis is linearly scaled.
* **Legend:** Located in the bottom-right corner.
* "Easy Mode" - Represented by a blue line with circle markers.
* "Hard Mode" - Represented by a red line with circle markers.
* **Gridlines:** Present to aid in reading values.
### Detailed Analysis
**Easy Mode (Blue Line):**
The blue line representing "Easy Mode" shows a generally upward trend, indicating increasing accuracy with each iteration.
* Iteration 1: Approximately 0.41
* Iteration 2: Approximately 0.42
* Iteration 3: Approximately 0.47
* Iteration 4: Approximately 0.50
* Iteration 5: Approximately 0.56
* Iteration 6: Approximately 0.60
* Iteration 7: Approximately 0.61
* Iteration 8: Approximately 0.62
* Iteration 9: Approximately 0.63
* Iteration 10: Approximately 0.63
**Hard Mode (Red Line):**
The red line representing "Hard Mode" also shows an upward trend, but it starts at a lower accuracy and increases more slowly than "Easy Mode".
* Iteration 1: Approximately 0.35
* Iteration 2: Approximately 0.35
* Iteration 3: Approximately 0.42
* Iteration 4: Approximately 0.48
* Iteration 5: Approximately 0.53
* Iteration 6: Approximately 0.57
* Iteration 7: Approximately 0.59
* Iteration 8: Approximately 0.60
* Iteration 9: Approximately 0.61
* Iteration 10: Approximately 0.61
### Key Observations
* "Easy Mode" consistently achieves higher accuracy than "Hard Mode" across all iterations.
* The rate of accuracy improvement decreases as the number of iterations increases for both modes. The curve flattens out.
* The initial accuracy for "Hard Mode" is significantly lower than for "Easy Mode".
* Both lines show a clear positive correlation between iteration number and accuracy.
### Interpretation
The data suggests that the algorithm or system being evaluated performs better in "Easy Mode" than in "Hard Mode", as evidenced by the consistently higher accuracy scores. The increasing accuracy with more iterations indicates that the system is learning or improving its performance over time. The flattening of the curves at higher iteration numbers suggests diminishing returns – further iterations yield smaller improvements in accuracy. The difference in initial accuracy between the two modes could indicate that "Hard Mode" presents a more challenging initial state or requires more iterations to reach a comparable level of performance. This could be due to a more complex problem space, a different set of constraints, or a more difficult learning landscape in "Hard Mode". The chart demonstrates the impact of mode difficulty on the learning process and the trade-off between iteration count and accuracy gain.