## Sector Diagram: Angular Relationships and Trigonometric Projections
### Overview
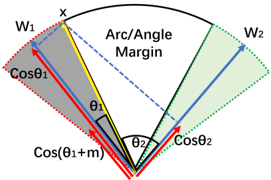
The diagram illustrates a geometric representation of two angular sectors (W1 and W2) with associated trigonometric relationships. It includes labeled angles (θ1, θ2), cosine terms (cosθ1, cosθ2, cos(θ1 + m)), and an "Arc/Angle Margin" between the sectors. A central point "x" marks the apex of the arc, with vectors and dashed lines indicating spatial relationships.
### Components/Axes
- **Labels**:
- **W1**: Left sector (red-shaded region).
- **W2**: Right sector (green-shaded region).
- **Arc/Angle Margin**: Dashed blue line separating W1 and W2.
- **θ1**: Angle at the base of W1 (left side).
- **θ2**: Angle at the base of W2 (right side).
- **cosθ1**: Red vector pointing toward W1.
- **cosθ2**: Green vector pointing toward W2.
- **cos(θ1 + m)**: Red vector with a modified angle (θ1 + m).
- **x**: Apex of the arc (top of the diagram).
- **Legend**:
- **Red**: W1 and cosθ1/cos(θ1 + m).
- **Green**: W2 and cosθ2.
- **Blue**: Arc/Angle Margin (dashed line).
- **Spatial Grounding**:
- Legend is positioned at the **top-right** of the diagram.
- W1 occupies the **left** side, W2 the **right**, with the arc margin between them.
- Angles θ1 and θ2 are at the **bottom**, with θ1 left of θ2.
### Detailed Analysis
- **Angles and Cosines**:
- θ1 and θ2 are labeled at the base of their respective sectors.
- cosθ1 and cosθ2 are vectors aligned with W1 and W2, respectively.
- cos(θ1 + m) introduces a phase or angular adjustment (m) to θ1, suggesting a modified projection.
- **Arc/Angle Margin**:
- The dashed blue line between W1 and W2 represents the angular separation (arc margin).
- This margin may correspond to a phase difference or spatial gap between the two sectors.
- **Point "x"**:
- Located at the **top** of the arc, it likely serves as a reference point for the angular measurements.
### Key Observations
1. **Symmetry and Asymmetry**:
- W1 and W2 are symmetric in structure but differ in angular relationships (θ1 vs. θ2).
- The arc margin introduces asymmetry, potentially indicating a non-uniform distribution.
2. **Trigonometric Projections**:
- The cosine terms (cosθ1, cosθ2, cos(θ1 + m)) suggest vector components or projections onto a reference axis.
- The modified angle (θ1 + m) implies a dependency on an additional parameter (m), possibly a phase shift or offset.
3. **Dashed Line Significance**:
- The arc margin (dashed blue) is critical for defining the relationship between W1 and W2, possibly representing a boundary or constraint.
### Interpretation
This diagram likely models a system involving **angular displacement** or **wave interference**, where:
- **W1 and W2** represent distinct waveforms or sectors with angular properties.
- **θ1 and θ2** quantify their respective angles, while **cosθ1/cosθ2** project these angles onto a reference axis (e.g., horizontal).
- The **arc margin** (dashed line) could symbolize a phase difference, path length discrepancy, or spatial separation between the two sectors.
- The term **cos(θ1 + m)** introduces a dynamic adjustment, suggesting the system accounts for external factors (e.g., time delay, environmental effects).
The diagram emphasizes the interplay between angular geometry and trigonometric projections, with the arc margin acting as a critical parameter for defining the relationship between W1 and W2. The use of color-coded vectors and dashed lines enhances clarity in distinguishing components and their interactions.