\n
## Chart: Importance Score vs. Reasoning Step
### Overview
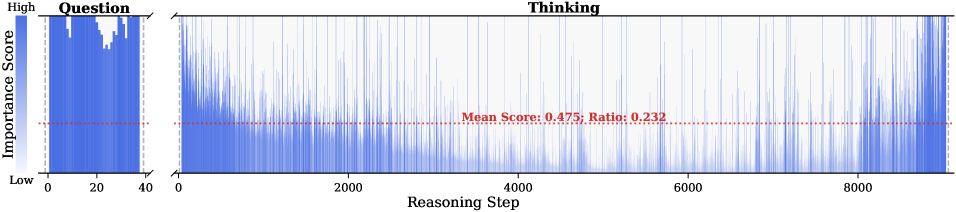
The image presents a chart visualizing the relationship between "Importance Score" and "Reasoning Step". The chart appears to represent the evolution of importance assigned to different reasoning steps during a problem-solving process, divided into "Question" and "Thinking" phases. The chart uses a bar-like representation for the "Question" phase and a line-like representation for the "Thinking" phase.
### Components/Axes
* **X-axis:** "Reasoning Step", ranging from 0 to approximately 8500.
* **Y-axis:** "Importance Score", ranging from "Low" to "High".
* **Chart Sections:** The chart is divided into two sections labeled "Question" (from 0 to approximately 40 on the x-axis) and "Thinking" (from approximately 40 to 8500 on the x-axis).
* **Horizontal Line:** A dashed red horizontal line is present, labeled "Mean Score: 0.475, Ratio: 0.232".
### Detailed Analysis
The "Question" phase (x=0 to 40) is represented by a blue bar chart. The importance score starts at a low value around x=0 and rapidly increases to a peak around x=15-20, then gradually decreases to a lower value by x=40. The peak importance score appears to be approximately 0.8-0.9, while the score at x=40 is around 0.3-0.4.
The "Thinking" phase (x=40 to 8500) is represented by a fluctuating blue line. The line oscillates around the dashed red horizontal line, indicating that the importance score during the thinking phase remains relatively stable, with frequent fluctuations. The line's amplitude (variation around the mean) appears to be approximately +/- 0.2. The line generally stays between an importance score of 0.2 and 0.6.
The mean importance score is 0.475, and the ratio is 0.232.
### Key Observations
* The "Question" phase exhibits a clear peak in importance score, suggesting a focused period of initial analysis.
* The "Thinking" phase shows a more distributed and fluctuating importance score, indicating a more exploratory and iterative process.
* The mean importance score provides a baseline for evaluating the overall importance assigned to reasoning steps.
* The ratio value (0.232) is not explicitly defined in the chart, but it likely represents a calculated metric related to the importance scores.
### Interpretation
The chart suggests a two-stage reasoning process. The "Question" phase involves a rapid assessment of initial information, leading to a peak in importance score. The "Thinking" phase represents a more prolonged and dynamic exploration of the problem, with fluctuating importance scores. The relatively stable mean importance score during the "Thinking" phase indicates that, on average, reasoning steps contribute consistently to the overall solution. The ratio value might represent the proportion of important reasoning steps within the "Thinking" phase, or a measure of efficiency. The difference in visualization between the two phases (bar chart vs. line graph) highlights the distinct nature of each stage. The initial burst of importance in the "Question" phase could represent the identification of key constraints or objectives, while the fluctuating importance in the "Thinking" phase could reflect the iterative refinement of potential solutions.