## Heatmap: Importance Scores Across Reasoning Steps
### Overview
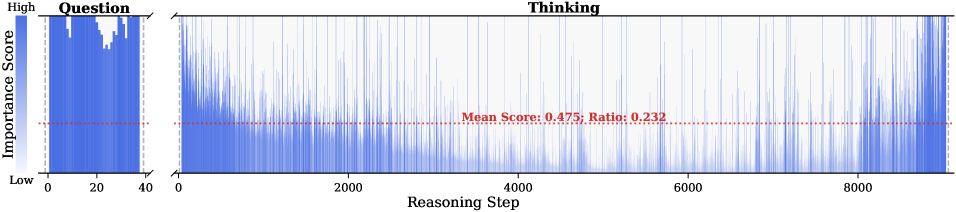
The image is a heatmap visualizing the distribution of "Importance Scores" across "Reasoning Steps" in two distinct phases: "Question" (left) and "Thinking" (right). The y-axis represents "Importance Score" (ranging from "Low" to "High"), while the x-axis represents "Reasoning Step" (0 to 8000). A red dashed line labeled with "Mean Score: 0.475; Ratio: 0.232" spans the "Thinking" section, indicating a statistical summary of the data.
---
### Components/Axes
- **Y-Axis (Importance Score)**:
- Labeled "Importance Score" with a gradient from "Low" (bottom) to "High" (top).
- No explicit numerical scale, but the red dashed line suggests a normalized range (likely 0–1).
- **X-Axis (Reasoning Step)**:
- Labeled "Reasoning Step" with numerical markers at 0, 20, 40, 2000, 4000, 6000, and 8000.
- Divided into two regions: "Question" (0–40) and "Thinking" (40–8000).
- **Legend**:
- Not explicitly labeled, but the blue gradient implies a continuous scale of importance scores.
- The red dashed line represents a statistical summary (mean and ratio).
---
### Detailed Analysis
#### "Question" Section (0–40 Reasoning Steps)
- **Visual Trend**:
- High concentration of dark blue (high importance scores) in the first 20 steps, followed by a sharp drop in importance after step 20.
- The "Question" phase shows a bimodal distribution, with two distinct peaks in importance.
- **Key Data Points**:
- Steps 0–10: High importance (dark blue).
- Steps 10–20: Moderate importance (lighter blue).
- Steps 20–40: Low importance (white/empty).
#### "Thinking" Section (40–8000 Reasoning Steps)
- **Visual Trend**:
- Importance scores are highly variable, with sporadic peaks and troughs.
- A gradual decline in overall importance from step 40 to 8000, with occasional spikes (e.g., around 2000, 4000, and 6000).
- **Statistical Summary**:
- **Mean Score**: 0.475 (moderate importance).
- **Ratio**: 0.232 (23.2% of steps have high importance scores).
- **Notable Features**:
- The red dashed line (mean score) is positioned near the middle of the y-axis, indicating a balanced distribution of scores.
- The "Thinking" phase shows no clear pattern, suggesting randomness or complexity in importance allocation.
---
### Key Observations
1. **Concentration in "Question" Phase**:
- The first 20 steps (Question) dominate in importance, with a sharp decline afterward.
2. **Variability in "Thinking" Phase**:
- The "Thinking" phase lacks a consistent pattern, with importance scores fluctuating unpredictably.
3. **Statistical Summary**:
- The mean score (0.475) and ratio (0.232) suggest that only a small fraction of steps in the "Thinking" phase are highly important.
4. **Red Dashed Line**:
- Acts as a reference for average importance, highlighting the disparity between the "Question" and "Thinking" phases.
---
### Interpretation
The data suggests that the "Question" phase is critical, with a concentrated allocation of importance scores in the initial steps. This implies that the problem's core elements are addressed early, while the "Thinking" phase involves exploratory or iterative reasoning with less predictable importance. The mean score of 0.475 and ratio of 0.232 indicate that while some steps in the "Thinking" phase are highly important, the majority are not, reflecting a sparse or fragmented reasoning process. The absence of a clear trend in the "Thinking" phase may point to inefficiencies or the need for refinement in later stages of reasoning.