## Web Interface: Image Annotation and Analysis Tool
### Overview
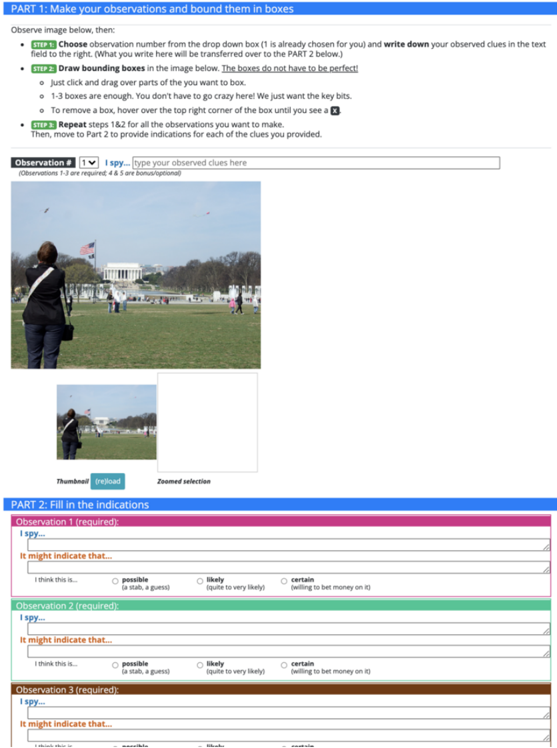
The image displays a web-based user interface designed for structured image analysis. The page is divided into two distinct sections: "PART 1," which focuses on identifying and bounding visual clues within a photograph, and "PART 2," which requires the user to provide interpretations and confidence levels for those observations. The interface appears to be an educational or crowdsourcing tool designed to train users in observational and deductive reasoning.
### Components/Axes
The interface is organized vertically:
* **Header 1 (Top):** A blue banner labeled "PART 1: Make your observations and bound them in boxes."
* **Instructional Block:** A bulleted list detailing the workflow for the user.
* **Input Row:** A control bar containing an "Observation #" dropdown (currently set to 1), and a text input field labeled "I spy...".
* **Main Image Area:** A photograph of the Lincoln Memorial in Washington D.C.
* **Thumbnail/Zoom Area:** Located below the main image, containing a "Thumbnail" view, a "(re)load" button, and a blank white box labeled "Zoomed selection."
* **Header 2 (Middle):** A blue banner labeled "PART 2: Fill in the indications."
* **Observation Sections:** Three stacked, color-coded sections (Observation 1, 2, and 3) with distinct borders (Pink, Green, and Brown, respectively).
### Detailed Analysis
#### Part 1: Instructions and Controls
* **Step 1:** "Choose observation number from the drop down box (1 is already chosen for you) and write down your observed clues in the text field to the right. (What you write here will be transferred over to the PART 2 below.)"
* **Step 2:** "Draw bounding boxes in the image below. The boxes do not have to be perfect!"
* "Just click and drag over parts of the you want to box."
* "1-3 boxes are enough. You don't have to go crazy here! We just want the key bits."
* "To remove a box, hover over the top right corner of the box until you see a x"
* **Step 3:** "Repeat steps 1&2 for all the observations you want to make. Then, move to Part 2 to provide indications for each of the clues you provided."
#### Part 2: Observation Sections
Each of the three sections (Observation 1, 2, and 3) contains identical input fields:
1. **"I spy..."**: A text input field.
2. **"It might indicate that..."**: A text input field.
3. **"I think this is..."**: A set of three radio buttons with associated descriptions:
* **possible**: "(a stab, a guess)"
* **likely**: "(quite to very likely)"
* **certain**: "(willing to bet money on it)"
### Key Observations
* **Workflow Logic:** The interface enforces a strict separation between the *observation* (what is physically present) and the *indication* (the inference drawn from that observation).
* **Dynamic Feedback:** The presence of a "Zoomed selection" box suggests that the interface is interactive and updates in real-time as the user draws bounding boxes on the main image.
* **Confidence Metrics:** The inclusion of a "certainty" scale (possible/likely/certain) allows the system to capture the user's subjective confidence level, which is useful for data quality control in crowdsourced tasks.
* **Visual Cues:** The use of distinct colors (Pink, Green, Brown) for the three observation blocks helps the user visually organize their thoughts and prevents confusion between the different entries.
### Interpretation
This interface is a structured framework for **abductive reasoning**—the process of forming an explanatory hypothesis from an observation. By forcing the user to first "spy" (observe) and then determine what it "might indicate" (infer), the tool minimizes the common cognitive error of jumping to conclusions without evidence.
The design is highly effective for training critical thinking or forensic analysis. It treats the image as a data source and the user as an analyst. The "certainty" scale is particularly insightful; it acknowledges that not all observations are equally reliable, allowing for a nuanced dataset where "certain" observations can be weighted more heavily than "possible" guesses. The interface is clean, functional, and minimizes cognitive load by breaking a complex analytical task into small, manageable steps.