TECHNICAL ASSET FINGERPRINT
945e3444db949dc48f1bb957
Click to view fullscreen
Press ESC or click to close
FOUND IN PAPERS
EXPERT: healer-alpha-free VERSION 1
RUNTIME: free/openrouter/healer-alpha
INTEL_VERIFIED
## Screenshot: Web-Based Observation Annotation Interface
### Overview
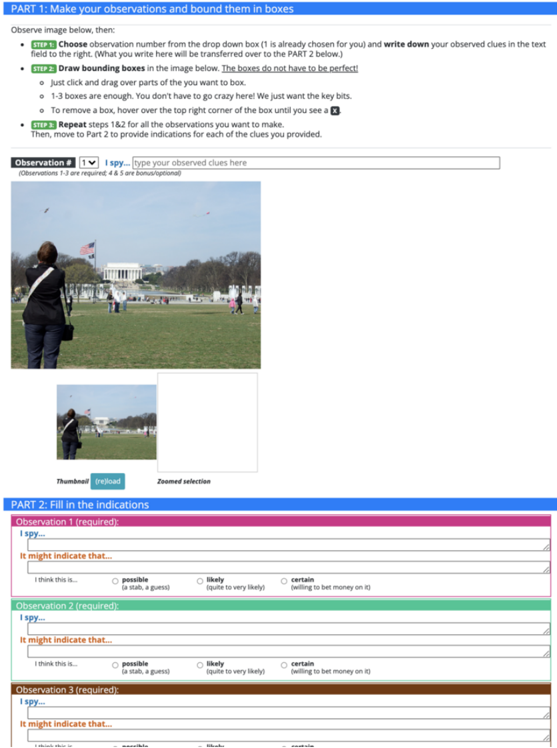
The image is a screenshot of a web-based interface designed for a two-part observation and annotation task. The interface is structured into two main sections: "PART 1: Make your observations and bound them in boxes" and "PART 2: Fill in the indications." It appears to be a tool for training or testing observational skills, where a user analyzes an image, selects regions of interest, and then interprets what those observations might mean.
### Components/Axes
The interface is divided into distinct functional regions:
**Header (PART 1):**
* A blue banner with the title: "PART 1: Make your observations and bound them in boxes".
* Instructional text below the banner, outlining a 3-step process:
* **STEP 1:** "Choose observation number from the drop down box (1 is already chosen for you) and **write down** your observed clues in the text field to the right. (What you write here will be transferred over to the PART 2 below.)"
* **STEP 2:** "**Draw bounding boxes** in the image below. **The boxes do not have to be perfect!**"
* Sub-bullets: "Just click and drag over parts of the image you want to mark.", "You can draw as many boxes as you want here! We just want the key bits.", "To remove a box, hover over the top right corner of the box until you see a ✕".
* **STEP 3:** "Repeat steps 1&2 for all the observations you want to make. Then, move to Part 2 to provide indications for each of the clues you provided."
**Observation Input Area (PART 1):**
* A dropdown menu labeled "Observation #", currently set to "1".
* A text input field with the placeholder: "I spy... [type your observed clues here]".
* A note below: "(Observation 1-3 are required. 4 & 5 are bonus/optional)".
**Main Image Display (PART 1):**
* A rectangular image showing an outdoor park scene. Key elements within this image:
* A person in the foreground (left side), wearing a dark jacket and jeans, facing away from the camera.
* A large, white, classical-style building (resembling the White House) in the background, centered.
* A green lawn between the person and the building.
* Several other people scattered in the mid-ground.
* Trees and a clear sky.
* An American flag is visible on a pole to the left of the building.
* Below the main image are two smaller boxes:
* **Left box:** Labeled "Thumbnail", containing a smaller version of the main image.
* **Right box:** Labeled "Zoomed selection", currently empty (white space).
**Header (PART 2):**
* A blue banner with the title: "PART 2: Fill in the indications".
**Observation Forms (PART 2):**
* Three identical, vertically stacked forms, each for a different observation.
* Each form has a colored header bar and contains:
* A title: "Observation [X] (required):" where X is 1, 2, or 3.
* A text area labeled "I spy...".
* A section titled "It might indicate that..." with a larger text area.
* A confidence selection area with the prompt "I think this is..." followed by three radio button options:
* "possible (a stab, a guess)"
* "likely (quite to very likely)"
* "certain (willing to bet money on it)"
* The header colors are:
* Observation 1: Pink/Magenta
* Observation 2: Green
* Observation 3: Brown/Dark Orange
### Detailed Analysis
The interface is a structured form with clear visual hierarchy.
* **Spatial Layout:** The layout is top-down and linear. Instructions are at the top, followed by the interactive observation area (dropdown, text input, image), and finally the interpretation forms. The "Thumbnail" and "Zoomed selection" boxes are positioned directly below the main image they relate to.
* **Text Transcription:** All visible text has been transcribed in the Components section above. The text is in English.
* **Interactive Elements:** The interface includes standard web form elements: a dropdown (`<select>`), text input fields (`<input type="text">`), text areas (`<textarea>`), and radio buttons (`<input type="radio">`). The instruction to "draw bounding boxes" implies a canvas or interactive image element.
* **Data Flow:** The design indicates a data pipeline: user input from Part 1 (observation text) is intended to be automatically transferred to the corresponding "I spy..." field in Part 2. The user then adds interpretive analysis and confidence levels in Part 2.
### Key Observations
1. **Instructional Clarity:** The interface provides very specific, step-by-step instructions for the user, including how to draw and remove bounding boxes.
2. **Required vs. Optional:** The system enforces a minimum of three observations (1-3 are required) but allows for two more (4 & 5 are optional).
3. **Visual Coding:** Color is used functionally to differentiate between the three observation forms in Part 2 (pink, green, brown).
4. **Confidence Metric:** The inclusion of a "possible/likely/certain" scale introduces a meta-cognitive layer, asking the user to assess their own certainty about their interpretations.
5. **Image Context:** The sample image used (a park with a prominent building) is a complex scene suitable for generating multiple observations (e.g., "person in foreground," "large white building," "American flag," "other people on lawn").
### Interpretation
This interface is a tool for **structured observation and hypothesis generation**. It breaks down the analytical process into discrete, manageable steps:
1. **Observation (Part 1):** The user identifies and records raw visual data ("I spy...") and spatially locates it (bounding boxes). This separates fact-finding from interpretation.
2. **Interpretation (Part 2):** The user then infers meaning from those observations ("It might indicate that...") and quantifies their confidence in that inference.
The design suggests its use in fields like **intelligence analysis, medical imaging, quality control, or educational testing**, where moving from raw sensory data to a reasoned conclusion is a critical skill. The "bounding box" requirement emphasizes the importance of spatial awareness and precise identification. The transfer of text from Part 1 to Part 2 ensures the interpretation is directly tied to the original observation, creating a clear audit trail for the reasoning process. The optional bonus observations (4 & 5) may be used to assess a user's thoroughness or ability to find less obvious details.
DECODING INTELLIGENCE...