## Diagram: State Transition Process
### Overview
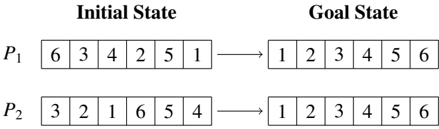
The diagram illustrates a state transition process involving two initial configurations (P₁ and P₂) that evolve into a unified goal state. Arrows indicate directional flow from disordered initial states to an ordered goal state.
### Components/Axes
- **Header**:
- Left: "Initial State" (bold text)
- Right: "Goal State" (bold text)
- **Main Sections**:
- **P₁ Row**:
- Initial State: `6 | 3 | 4 | 2 | 5 | 1`
- Goal State: `1 | 2 | 3 | 4 | 5 | 6`
- **P₂ Row**:
- Initial State: `3 | 2 | 1 | 6 | 5 | 4`
- Goal State: `1 | 2 | 3 | 4 | 5 | 6`
- **Arrows**:
- Two arrows labeled "1" connect initial states to goal states.
- **Legend**: None explicitly present.
### Detailed Analysis
- **Initial State (P₁)**: Numbers are permuted as `[6, 3, 4, 2, 5, 1]`.
- **Initial State (P₂)**: Numbers are permuted as `[3, 2, 1, 6, 5, 4]`.
- **Goal State**: Both P₁ and P₂ converge to the sorted sequence `[1, 2, 3, 4, 5, 6]`.
- **Flow**: Arrows suggest a single-step transformation (labeled "1") from initial to goal states.
### Key Observations
1. Both initial states contain the same set of numbers (1–6) but in different orders.
2. The goal state represents a canonical sorted order, independent of the initial permutation.
3. The arrow labels ("1") imply a minimal or atomic transformation step, though the mechanism is unspecified.
### Interpretation
This diagram abstracts a **normalization process** where disparate initial configurations (P₁ and P₂) are transformed into a standardized goal state. The uniformity of the goal state suggests:
- A **deterministic sorting algorithm** or **constraint satisfaction** mechanism.
- The arrow labels ("1") may represent a single operation (e.g., a swap, rotation, or insertion) sufficient to achieve the goal, though the exact method is not depicted.
- The convergence of both P₁ and P₂ to the same goal state highlights **idempotency**—different starting points yield identical outcomes under the defined transformation.
The absence of intermediate steps or additional labels leaves the process's computational complexity or real-world application ambiguous. However, the structure aligns with problems in **permutation sorting**, **state-space reduction**, or **system equilibrium modeling**.