\n
## Diagram: State Transition Representation
### Overview
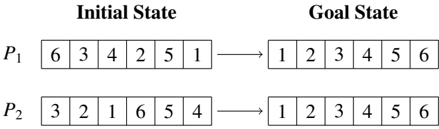
The image presents a diagram illustrating the transition from an "Initial State" to a "Goal State" for two permutations, labeled P₁ and P₂. Each permutation is represented as a sequence of numbers within a rectangular box. An arrow indicates the transformation from the initial to the goal state.
### Components/Axes
The diagram consists of two main columns labeled "Initial State" and "Goal State". Each column contains two rows, labeled P₁ and P₂. Each row represents a permutation of the numbers 1 through 6. The permutations are displayed as a horizontal sequence of numbers within a rectangular box. Arrows point from the initial state to the goal state for each permutation.
### Detailed Analysis or Content Details
**P₁:**
* **Initial State:** The sequence is 6, 3, 4, 2, 5, 1.
* **Goal State:** The sequence is 1, 2, 3, 4, 5, 6.
**P₂:**
* **Initial State:** The sequence is 3, 2, 1, 6, 5, 4.
* **Goal State:** The sequence is 1, 2, 3, 4, 5, 6.
### Key Observations
Both permutations, P₁ and P₂, start in a disordered state and transition to the same ordered goal state (1, 2, 3, 4, 5, 6). The initial states are different, indicating different starting points for the transformation.
### Interpretation
This diagram likely represents a problem in search algorithms or state-space search. The "Initial State" represents the starting configuration, the "Goal State" represents the desired configuration, and the arrow implies a series of operations or steps to transform one into the other. The two permutations suggest that there might be multiple paths or solutions to reach the same goal state. The problem could be related to sorting algorithms, puzzle solving (like the 15-puzzle), or any scenario where a system needs to transition from an initial configuration to a target configuration. The diagram doesn't provide information about the specific operations used to achieve the transition, only the initial and final states.