# Technical Document Extraction: Conductance Spectra Analysis
## Graph (a): Δ = 0 meV (Black) vs Δ = 5 meV (Blue)
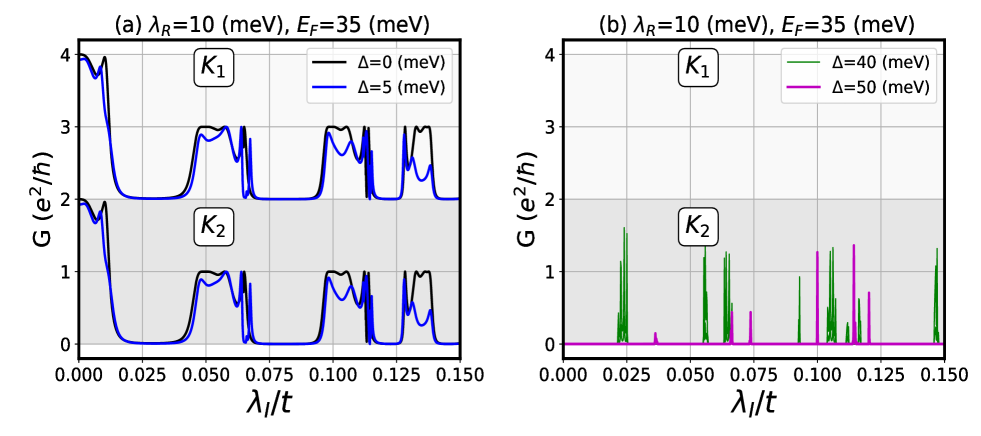
- **Parameters**:
- Rashba splitting: λ_R = 10 meV
- Fermi energy: E_F = 35 meV
- **Axes**:
- X-axis: λ_I/t (0.000 to 0.150)
- Y-axis: Conductance G (e²/h) (0 to 4)
- **Key Features**:
- **K1 Region**:
- Δ = 0 meV: Sharp, periodic peaks at λ_I/t ≈ 0.025, 0.075, 0.125.
- Δ = 5 meV: Peaks slightly suppressed and broadened compared to Δ = 0.
- **K2 Region**:
- Δ = 0 meV: Peaks at λ_I/t ≈ 0.050, 0.100, 0.150.
- Δ = 5 meV: Peaks reduced in height and spacing irregular.
- **Trend**: Increasing Δ suppresses conductance peaks, particularly in K2.
## Graph (b): Δ = 40 meV (Green) vs Δ = 50 meV (Pink)
- **Parameters**:
- Rashba splitting: λ_R = 10 meV
- Fermi energy: E_F = 35 meV
- **Axes**:
- X-axis: λ_I/t (0.000 to 0.150)
- Y-axis: Conductance G (e²/h) (0 to 4)
- **Key Features**:
- **K1 Region**:
- Δ = 40 meV: Sharp, narrow peaks at λ_I/t ≈ 0.025, 0.075, 0.125.
- Δ = 50 meV: Peaks broadened and less intense.
- **K2 Region**:
- Δ = 40 meV: Peaks at λ_I/t ≈ 0.050, 0.100, 0.150 with moderate height.
- Δ = 50 meV: Peaks taller but fewer (e.g., λ_I/t ≈ 0.075, 0.125).
- **Trend**: Higher Δ (50 meV) enhances peak intensity in K2 but reduces resolution.
## Cross-Reference Summary
- **Legend Consistency**:
- Graph (a): Black (Δ = 0) and Blue (Δ = 5) match line colors.
- Graph (b): Green (Δ = 40) and Pink (Δ = 50) align with line colors.
- **Common Observations**:
- Conductance peaks correlate with λ_I/t values near K1/K2 regions.
- Larger Δ values (5 meV, 40 meV, 50 meV) generally suppress or broaden peaks compared to Δ = 0.
- K2 region exhibits more pronounced Δ-dependent variations than K1.