## Line Graph: Execution Time vs. Max Region Size
### Overview
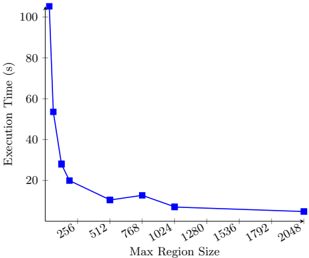
The image depicts a line graph illustrating the relationship between execution time (in seconds) and maximum region size. The graph shows a sharp decline in execution time as the maximum region size increases, followed by a plateau effect at larger region sizes.
### Components/Axes
- **Y-Axis (Left)**: Labeled "Execution Time (s)" with a scale from 0 to 100 seconds in increments of 20.
- **X-Axis (Bottom)**: Labeled "Max Region Size" with values: 256, 512, 768, 1024, 1280, 1536, 1792, 2048.
- **Data Series**: A single blue line with square markers connects data points at each x-axis value.
- **Legend**: Not explicitly visible in the image, but the line is described as blue with square markers.
### Detailed Analysis
- **Data Points**:
- 256: ~100 seconds
- 512: ~50 seconds
- 768: ~20 seconds
- 1024: ~10 seconds
- 1280: ~8 seconds
- 1536: ~7 seconds
- 1792: ~6 seconds
- 2048: ~5 seconds
- **Trend**: The execution time decreases exponentially as the maximum region size increases. The steepest drop occurs between 256 and 512, after which the decline slows significantly, approaching a plateau near 5 seconds for region sizes ≥1024.
### Key Observations
1. **Exponential Decline**: Execution time halves when the region size doubles from 256 to 512, then continues to drop rapidly until 1024.
2. **Diminishing Returns**: Beyond 1024, execution time stabilizes, with only marginal improvements (e.g., 10s → 8s → 7s → 6s → 5s).
3. **Outlier**: The initial execution time at 256 (100s) is an outlier compared to the trend observed at larger region sizes.
### Interpretation
The data suggests that increasing the maximum region size significantly improves performance up to a critical threshold (~1024). Beyond this point, further increases yield negligible benefits, indicating an optimal region size for efficiency. The sharp decline at smaller sizes may reflect computational overhead or inefficiencies in processing smaller regions, while larger regions likely leverage parallelism or batch processing to reduce execution time. The plateau effect implies a saturation point where system resources (e.g., memory, CPU) are fully utilized, limiting further optimization.