# Technical Document Extraction: Attention over Values, a=8
## Chart Overview
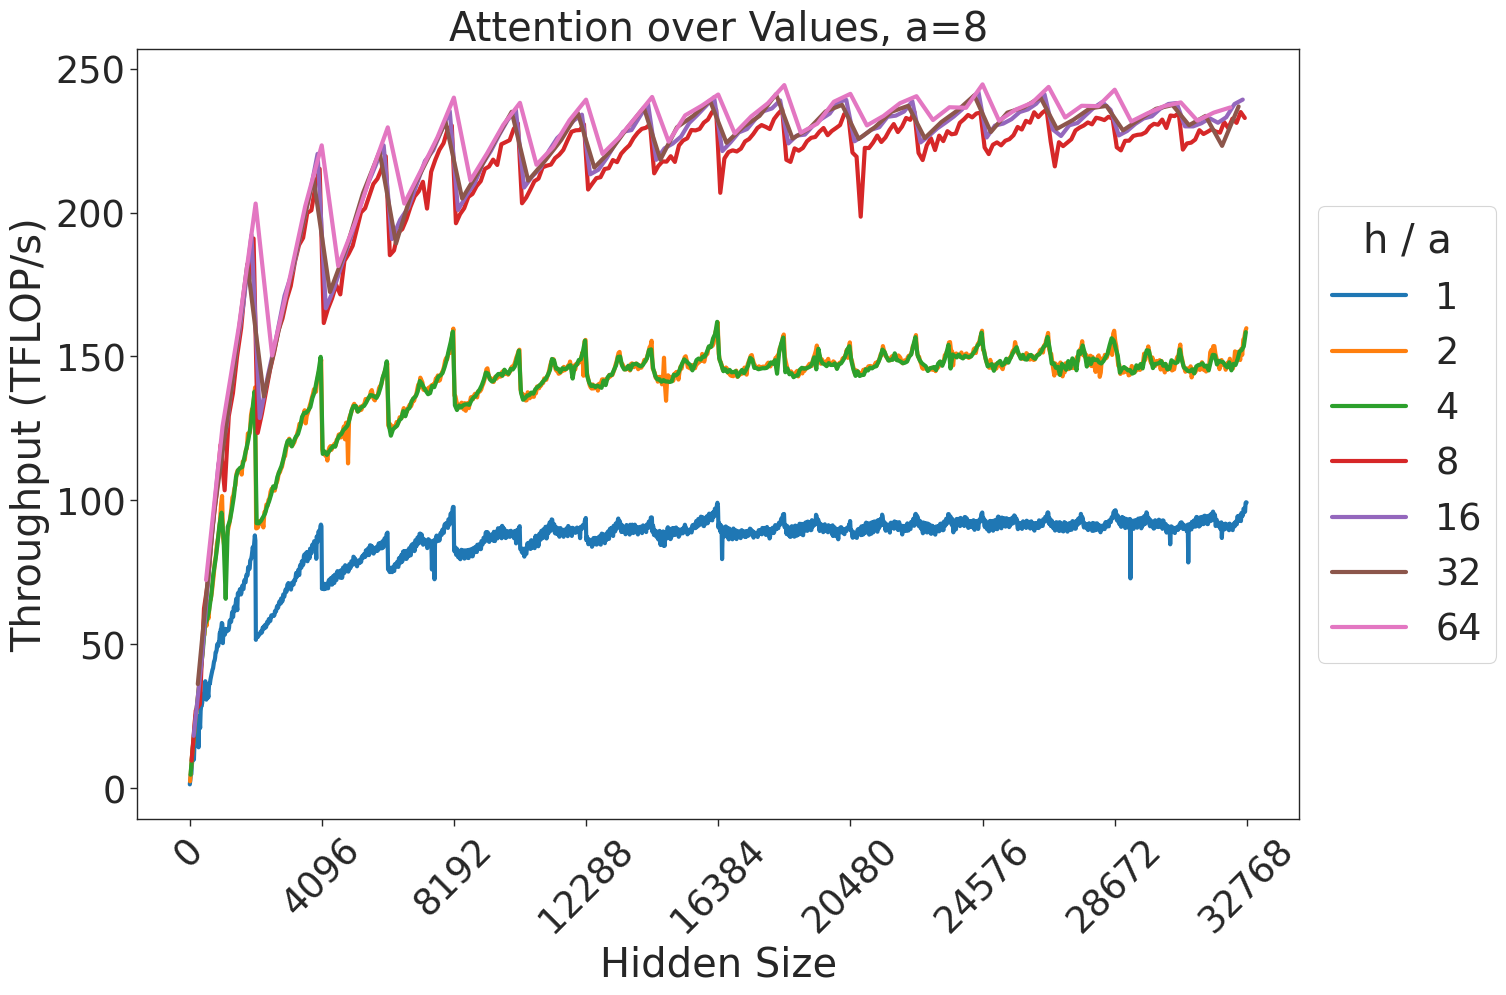
- **Title**: Attention over Values, a=8
- **Type**: Line graph
- **Purpose**: Visualizes throughput (TFLOPs/s) across varying hidden sizes for different h/a ratios.
---
## Axis Labels and Markers
- **X-axis (Hidden Size)**:
- Range: 0 to 32,768
- Markers: 0, 4,096, 8,192, 12,288, 16,384, 20,480, 24,576, 28,672, 32,768
- **Y-axis (Throughput (TFLOPs/s))**:
- Range: 0 to 250
- Markers: 0, 50, 100, 150, 200, 250
---
## Legend
- **Location**: Right of the plot area
- **Labels and Colors**:
- `h/a = 1` → Blue
- `h/a = 2` → Orange
- `h/a = 4` → Green
- `h/a = 8` → Red
- `h/a = 16` → Purple
- `h/a = 32` → Brown
- `h/a = 64` → Pink
---
## Key Trends and Data Points
### Line Analysis
1. **Blue (h/a=1)**:
- **Trend**: Gradual increase from 0 to ~100 TFLOPs/s, then plateaus.
- **Key Points**:
- At hidden size 0: 0 TFLOPs/s
- At hidden size 32,768: ~100 TFLOPs/s
2. **Orange (h/a=2)**:
- **Trend**: Similar to blue but with sharper initial rise; plateaus ~150 TFLOPs/s.
- **Key Points**:
- At hidden size 0: 0 TFLOPs/s
- At hidden size 32,768: ~150 TFLOPs/s
3. **Green (h/a=4)**:
- **Trend**: Slightly higher than orange; plateaus ~150 TFLOPs/s.
- **Key Points**:
- At hidden size 0: 0 TFLOPs/s
- At hidden size 32,768: ~150 TFLOPs/s
4. **Red (h/a=8)**:
- **Trend**: Peaks early (~200 TFLOPs/s at hidden size 4,096), then fluctuates downward.
- **Key Points**:
- At hidden size 0: 0 TFLOPs/s
- Peak: ~200 TFLOPs/s at hidden size 4,096
- At hidden size 32,768: ~220 TFLOPs/s
5. **Purple (h/a=16)**:
- **Trend**: Highest initial throughput (~250 TFLOPs/s), stabilizes with minor fluctuations.
- **Key Points**:
- At hidden size 0: 0 TFLOPs/s
- Peak: ~250 TFLOPs/s at hidden size 4,096
- At hidden size 32,768: ~240 TFLOPs/s
6. **Brown (h/a=32)**:
- **Trend**: Matches purple in initial peak (~250 TFLOPs/s), stabilizes.
- **Key Points**:
- At hidden size 0: 0 TFLOPs/s
- Peak: ~250 TFLOPs/s at hidden size 4,096
- At hidden size 32,768: ~240 TFLOPs/s
7. **Pink (h/a=64)**:
- **Trend**: Highest throughput (~250 TFLOPs/s), minimal fluctuations.
- **Key Points**:
- At hidden size 0: 0 TFLOPs/s
- Peak: ~250 TFLOPs/s at hidden size 4,096
- At hidden size 32,768: ~240 TFLOPs/s
---
## Spatial Grounding
- **Legend Position**: Right of the plot area (outside the chart boundaries).
- **Color Consistency**: All lines match their legend labels (e.g., blue = h/a=1, pink = h/a=64).
---
## Component Isolation
1. **Header**:
- Title: "Attention over Values, a=8"
- No additional text.
2. **Main Chart**:
- Axes, gridlines, and seven data series (lines).
3. **Footer**:
- Legend with seven entries (h/a ratios and colors).
---
## Observations
- **Throughput Scaling**: Higher h/a ratios (e.g., 64) achieve higher throughput but plateau earlier.
- **Hidden Size Impact**: Throughput increases with hidden size up to ~4,096, then stabilizes or fluctuates.
- **a=8 Context**: The parameter `a=8` is fixed; variations are driven by h/a ratios.
---
## Notes
- No data tables or embedded text blocks present.
- All textual information extracted from axis labels, legend, and title.
- No non-English text detected.