\n
## Diagram: Oscillator Sampling Sequence & Dynamics
### Overview
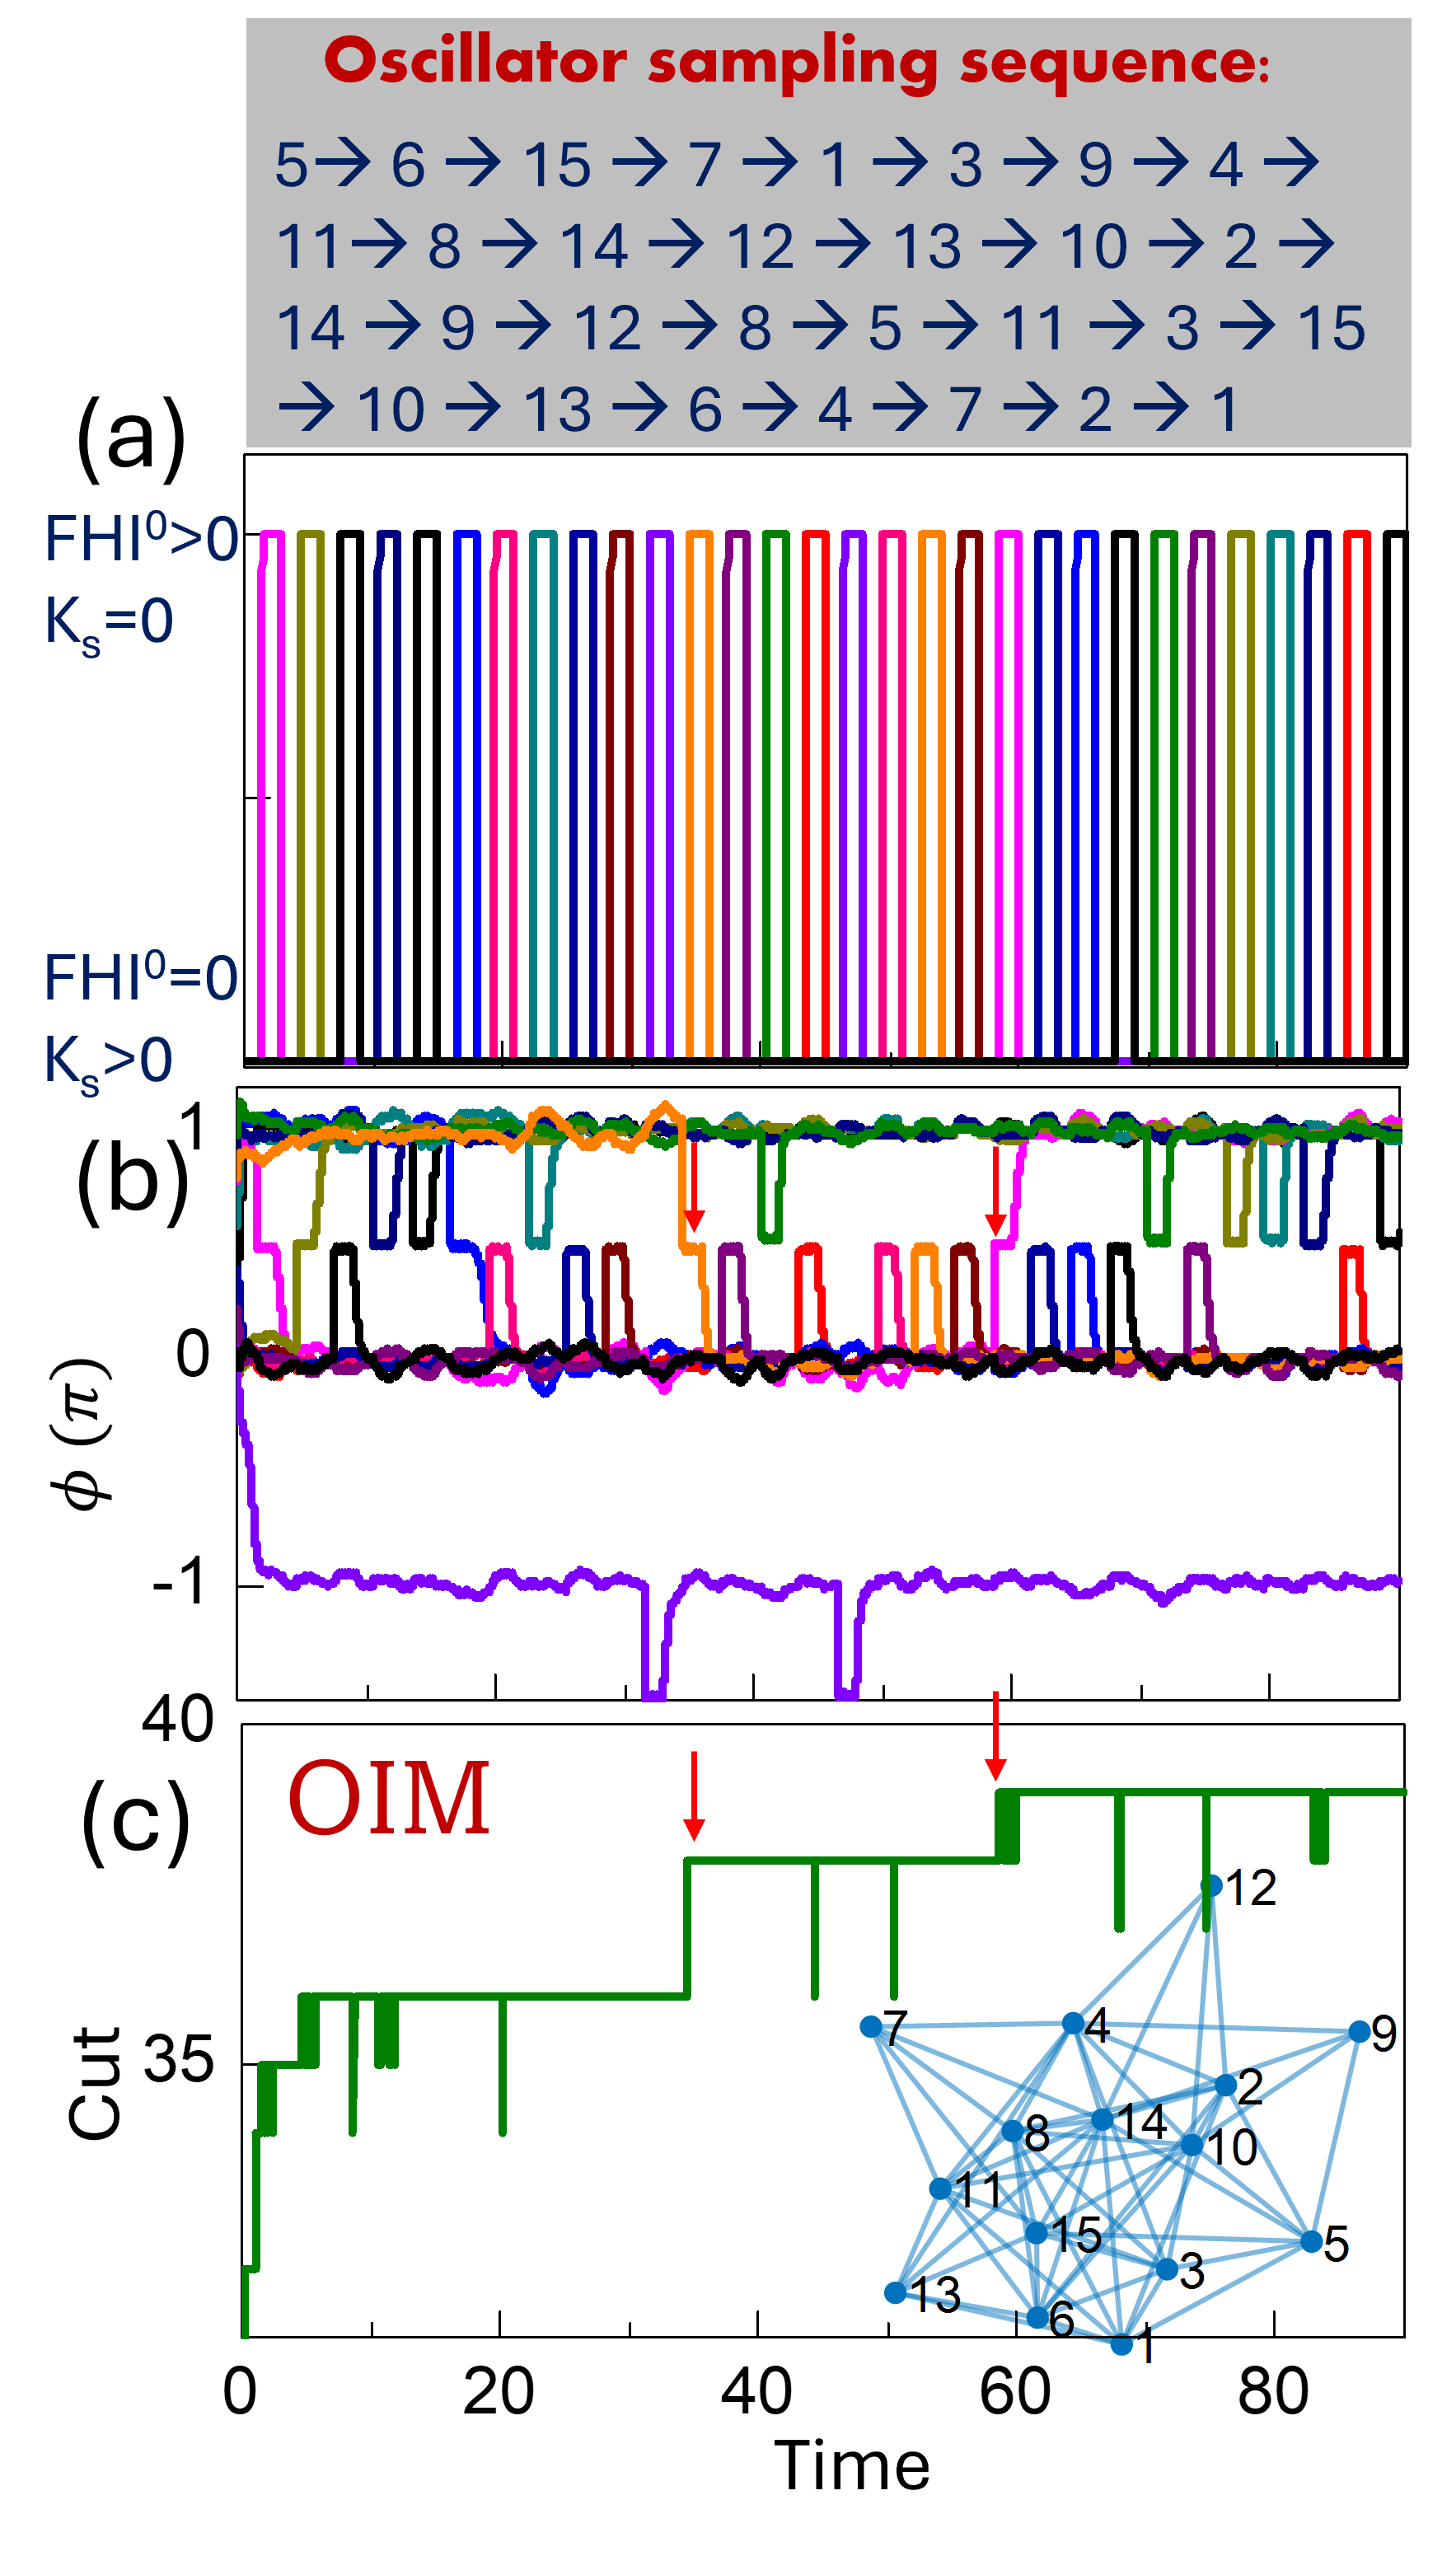
The image presents a series of three sub-diagrams (labeled a, b, and c) illustrating an oscillator sampling sequence and its associated dynamics. The top diagram (a) defines the sampling sequence. The middle diagram (b) shows the phase (Φ) of the oscillator over time, and the bottom diagram (c) depicts the Order-of-Interaction Metric (OIM) and the corresponding state transitions of the oscillator. The diagrams are arranged vertically, with time as the primary independent variable in diagrams (b) and (c).
### Components/Axes
* **Diagram (a):** Text block defining the oscillator sampling sequence.
* **Diagram (b):**
* **Y-axis:** Phase (Φ) with a scale ranging from approximately -1.5 to 1.5.
* **X-axis:** Time, with tick marks at intervals of approximately 10 units.
* **Data Series:** A single, oscillating line representing the phase of the oscillator.
* **Diagram (c):**
* **Y-axis:** Order-of-Interaction Metric (OIM) with a scale ranging from approximately 25 to 40.
* **X-axis:** Time, with tick marks at intervals of approximately 10 units.
* **Data Series:** A step-like function representing the OIM, with several discrete jumps.
* **State Transitions:** Numbered circles (1-15) representing the oscillator's states, connected by arrows indicating the sampling sequence.
* **Red Arrows:** Two red arrows pointing downwards, indicating specific points in time.
### Detailed Analysis or Content Details
**Diagram (a): Oscillator Sampling Sequence**
The sequence is: 5 → 6 → 15 → 7 → 1 → 3 → 9 → 4 → 11 → 8 → 14 → 12 → 13 → 10 → 2 → 14 → 9 → 12 → 8 → 5 → 11 → 3 → 15 → 10 → 13 → 6 → 4 → 7 → 2 → 1
**Diagram (b): Phase (Φ)**
The phase oscillates between approximately -1.2 and 1.2. The oscillation appears roughly periodic, with a period of approximately 20 time units. The amplitude of the oscillation appears to decrease slightly over time. The phase is approximately 0 at time = 0.
**Diagram (c): OIM and State Transitions**
* The OIM starts at approximately 35 and remains constant until approximately time = 20, where it drops to approximately 28.
* The OIM then increases to approximately 38 by time = 40.
* A significant drop in OIM occurs at approximately time = 45, falling to around 30.
* The OIM then fluctuates, reaching a peak of approximately 38 again around time = 70.
* The state transitions follow the sequence defined in diagram (a). The numbered circles represent the oscillator's state at each point in time.
* The first red arrow points to a time of approximately 40, and the second red arrow points to a time of approximately 60.
### Key Observations
* The OIM appears to be related to the phase of the oscillator, with drops in OIM coinciding with changes in the oscillator's state.
* The sampling sequence dictates the order in which the oscillator transitions between states.
* The phase oscillation appears to be dampened over time.
* The red arrows highlight specific points in time where the OIM experiences a significant change.
### Interpretation
The diagrams illustrate a system where an oscillator's state is sampled according to a predefined sequence. The OIM provides a measure of the complexity or interaction within the oscillator's state space. The phase diagram shows the oscillator's internal dynamics, while the OIM diagram reveals how the sampling process influences these dynamics. The drops in OIM likely correspond to transitions between different modes of oscillation or changes in the system's stability. The sampling sequence appears to drive the oscillator through a series of states, potentially exploring different regions of its state space. The decreasing amplitude of the phase oscillation suggests that the system may be losing energy or approaching a stable state. The red arrows likely indicate critical points in the sampling process where the system's behavior changes significantly. The entire system seems to be designed to explore the state space of the oscillator in a controlled manner, using the sampling sequence and OIM as tools for analysis and manipulation.