## Multi-Panel Oscillator Sampling and Network Analysis Figure
### Overview
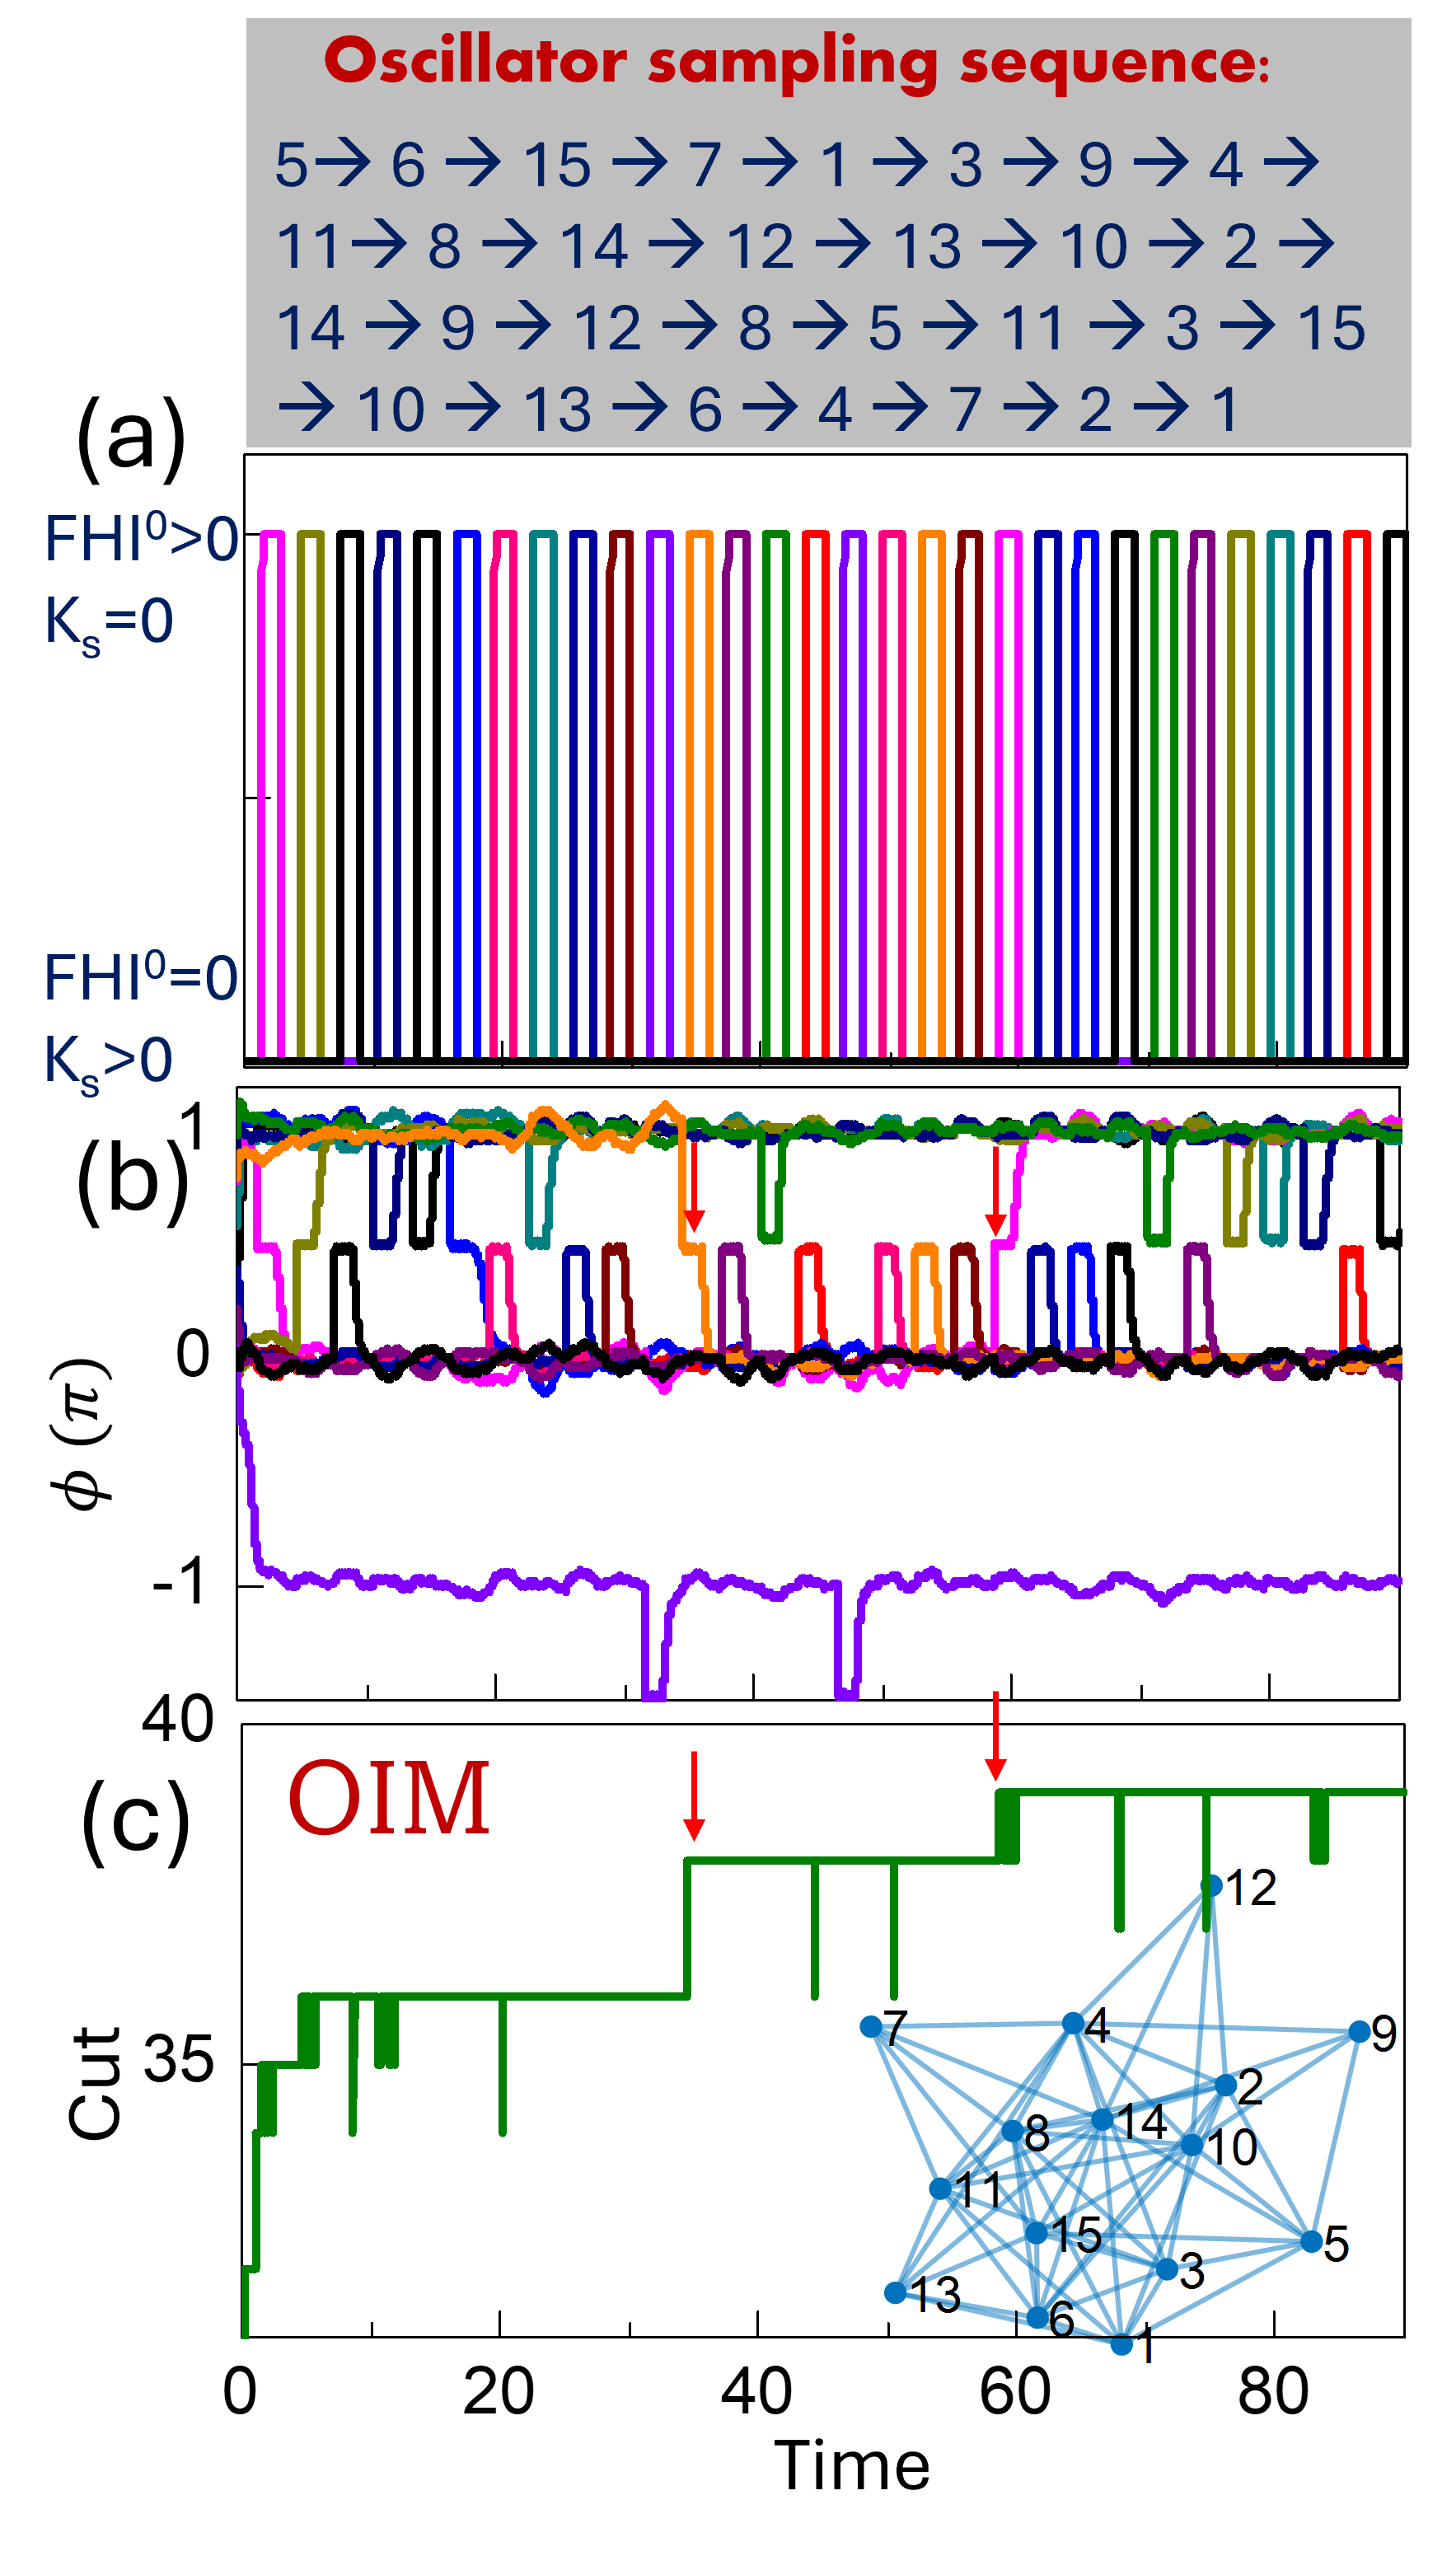
The image is a three-panel technical figure (labeled (a), (b), (c)) illustrating oscillator sampling dynamics, phase behavior, and a network "Cut" metric, with a top text box defining a sampling sequence. It combines time-series plots, a sampling sequence, and a network diagram to relate oscillator sampling to network properties.
### Components/Axes
#### Top Text Box
- **Title**: "Oscillator sampling sequence:" (red text)
- **Sequence**: A directed sequence of oscillator indices:
`5→6→15→7→1→3→9→4→11→8→14→12→13→10→2→14→9→12→8→5→11→3→15→10→13→6→4→7→2→1`
(Note: Some indices repeat, e.g., 14, 9, 12, 8, 5, 11, 3, 15, 10, 13, 6, 4, 7, 2, 1 appear multiple times.)
#### Panel (a): Oscillator State Plot
- **Left Labels**:
- Top row: `FHI⁰>0 Kₛ=0`
- Bottom row: `FHI⁰=0 Kₛ>0`
- **Content**: Vertical colored bars (matching panel (b)’s line colors) aligned with the sampling sequence above. Each bar likely represents the state of an oscillator at a sampling step.
#### Panel (b): Phase Time-Series Plot
- **Y-axis**: Label `φ(π)` (phase in units of π), ticks at `-1`, `0`, `1`.
- **Content**: Multiple colored lines (matching panel (a)’s bars) showing phase evolution over time. Red arrows mark specific time points (aligned with panel (c)’s step changes).
#### Panel (c): "Cut" Metric Time-Series Plot
- **Y-axis**: Label `Cut`, ticks at `35`, `40`.
- **X-axis**: Label `Time`, ticks at `0`, `20`, `40`, `60`, `80`.
- **Content**: A green stepwise line showing the "Cut" value increasing over time. Red arrows mark step increases (aligned with panel (b)’s arrows).
- **Inset**: A network diagram with 15 blue nodes labeled `1`–`15`, connected by blue edges (indicating oscillator interactions).
### Detailed Analysis
#### Panel (a)
The vertical bars are color-coded (e.g., pink, yellow, black, blue, green, red, orange, purple) and correspond to oscillators in the sampling sequence. The two rows distinguish oscillator states: `FHI⁰>0 Kₛ=0` (top) and `FHI⁰=0 Kₛ>0` (bottom).
#### Panel (b)
- **Phase Trends**: Most lines cluster near `φ=1` or `φ=0`, indicating synchronized or grouped phase behavior. One purple line remains near `φ=-1` with periodic dips (e.g., at time ~30 and ~60).
- **Red Arrows**: Point to time points where the "Cut" value in panel (c) increases, linking phase dynamics to the Cut metric.
#### Panel (c)
- **Cut Metric**: The green line increases in discrete steps:
- Starts below `35` at `Time=0`.
- Jumps to ~`35` at `Time≈10`.
- Jumps to ~`38` at `Time≈30` (first red arrow).
- Jumps to ~`40` at `Time≈60` (second red arrow).
- **Inset Network**: Nodes `1`–`15` are connected by multiple edges, forming a dense, interconnected graph (likely representing oscillator coupling).
### Key Observations
1. **Sampling Sequence**: The sequence includes repeated indices (e.g., 14, 9, 12), suggesting a non-permutational sampling strategy.
2. **Phase Clustering**: Most oscillators cluster in two phase groups (`φ≈1` and `φ≈0`), with one outlier (purple line) at `φ≈-1`.
3. **Cut Metric Steps**: The "Cut" value increases only at specific time points (marked by red arrows), indicating discrete events driving network changes.
4. **Color Consistency**: Colors in panels (a) and (b) are identical, linking oscillator states to their phase dynamics.
### Interpretation
The figure illustrates a process where oscillators are sampled in a defined sequence (top text), their phases are tracked (panel b), and a "Cut" metric (likely a network partition or synchronization measure) evolves over time (panel c). The step increases in the Cut metric correspond to specific sampling events (red arrows), suggesting that certain sampling steps trigger changes in the network’s structure or synchronization. The inset network confirms the oscillators are interconnected, implying the sampling sequence interacts with the network topology to modify the Cut metric. The phase clustering indicates partial synchronization, with the outlier (purple line) possibly representing a desynchronized oscillator. This setup likely models how targeted sampling of oscillators affects network-level properties (e.g., synchronization or partitioning).