## Oscillator Sampling Sequence and Dynamics Analysis
### Overview
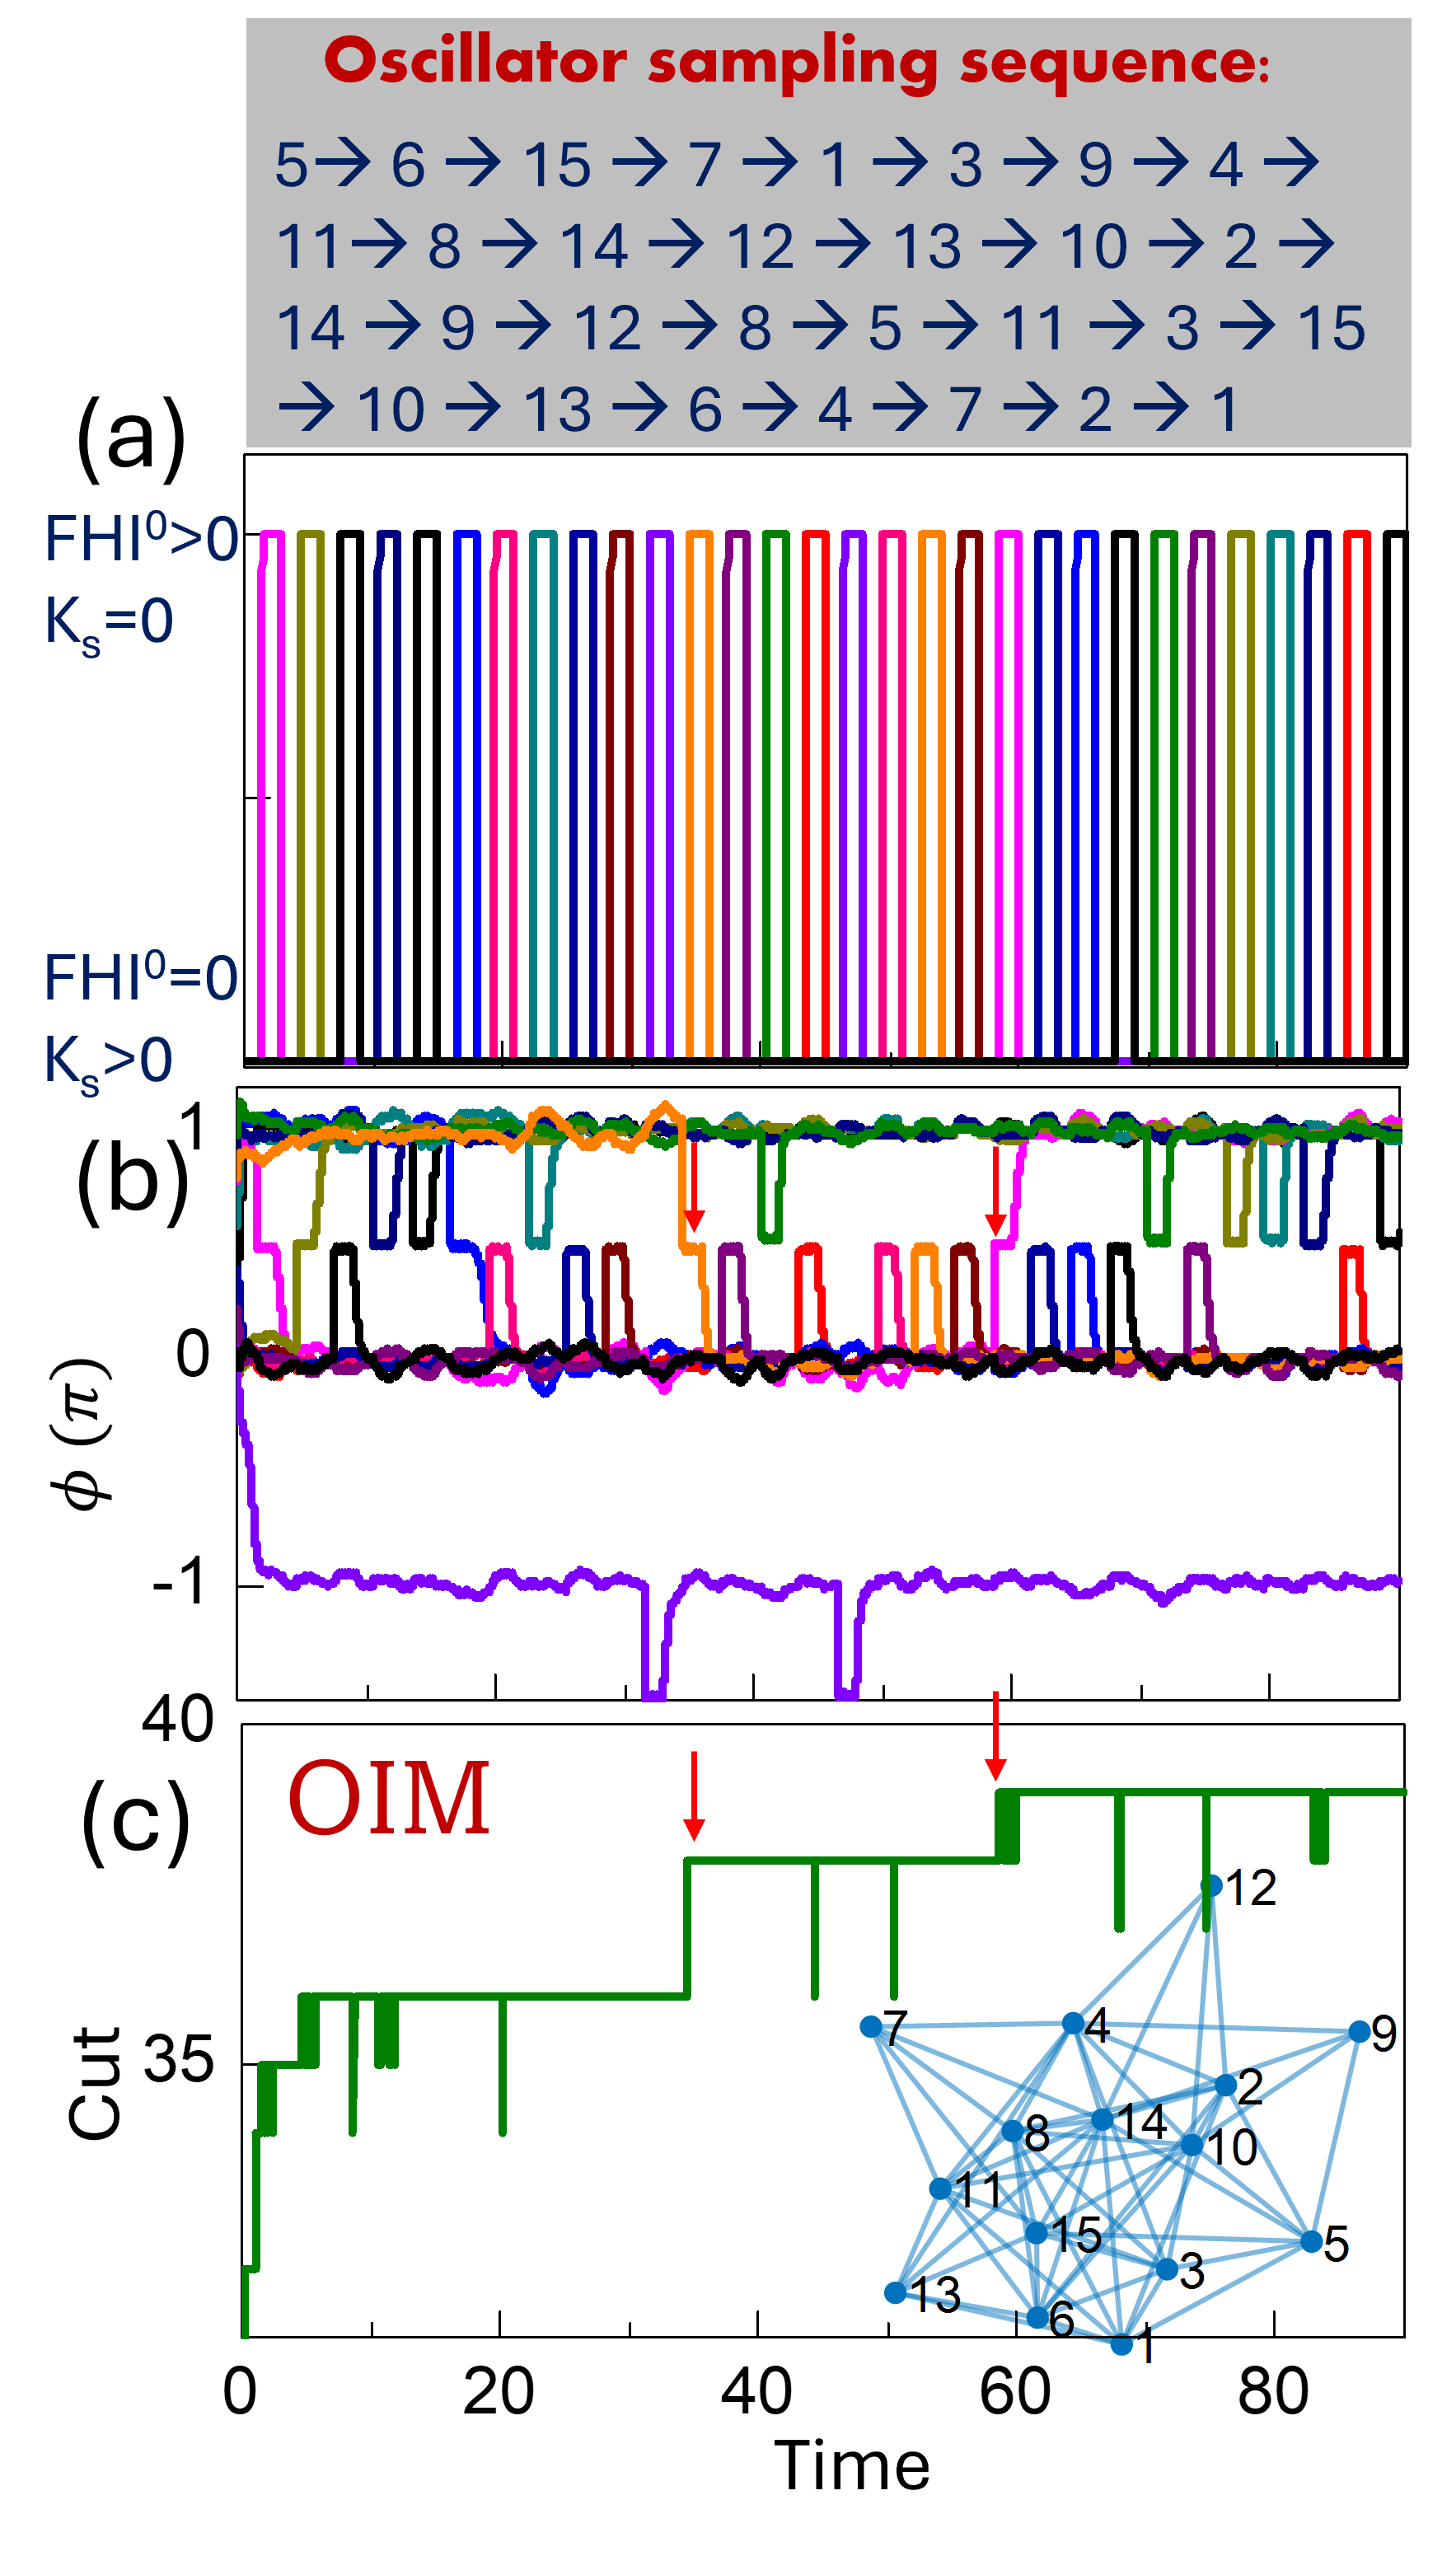
The image presents a multi-part technical analysis of an oscillator system, combining sampling sequences, phase dynamics, and network partitioning. It includes three distinct components: (a) a sampling sequence with color-coded transitions, (b) phase dynamics over time, and (c) a network partitioning diagram.
---
### Components/Axes
#### (a) Sampling Sequence
- **Header**: "Oscillator sampling sequence:" in red text.
- **Transition Arrows**:
- Sequence: `5 → 6 → 15 → 7 → 1 → 3 → 9 → 4 → 11 → 8 → 14 → 12 → 13 → 10 → 2 → 14 → 9 → 12 → 8 → 5 → 11 → 3 → 15 → 10 → 13 → 6 → 4 → 7 → 2 → 1`
- Arrows are blue, with numbers in black.
- **Vertical Bars**:
- **Top Set**: Labeled `FHI⁰ > 0, Kₛ = 0` (pink, black, blue, teal, purple, orange, brown, green, red, etc.).
- **Bottom Set**: Labeled `FHI⁰ = 0, Kₛ > 0` (same color palette).
- Colors are evenly distributed across the bars, with no explicit legend provided in the image.
#### (b) Phase Dynamics (φ(π) vs. Time)
- **Axes**:
- **X-axis**: "Time" (0–80, linear scale).
- **Y-axis**: "φ(π)" (range: -1 to 1, with a secondary axis labeled "40" at the bottom).
- **Data Series**:
- Multiple colored lines (pink, black, blue, teal, purple, orange, brown, green, red) representing different states or parameters.
- Arrows point to specific time points (e.g., ~50, ~60, ~70) with annotations like "↓" and "↓".
- **Legend**: Not explicitly visible in the image, but colors correspond to distinct data series.
#### (c) Network Partitioning (OIM)
- **Title**: "OIM" in red text.
- **Graph**:
- Nodes labeled 1–15, connected by blue lines.
- A vertical green "cut" line at **time = 35**, intersecting nodes 1, 3, 5, 6, 7, 8, 9, 10, 11, 12, 13, 14, 15.
- Nodes are densely interconnected, forming a complex network.
- **Annotations**:
- "Cut 35" labeled on the y-axis (left side).
---
### Detailed Analysis
#### (a) Sampling Sequence
- The sequence shows a cyclical pattern of transitions between 15 states (1–15), with some states revisited (e.g., 14 → 9 → 12 → 8 → 5 → 11 → 3 → 15).
- The two sets of vertical bars likely represent two experimental conditions:
- **FHI⁰ > 0, Kₛ = 0**: Higher variability in transitions (more color diversity).
- **FHI⁰ = 0, Kₛ > 0**: More uniform transitions (consistent color distribution).
#### (b) Phase Dynamics
- **Trends**:
- All lines oscillate around φ(π) = 0, with some dipping below -1 (e.g., purple line at ~50).
- The orange line shows the most pronounced dips, while the black line remains relatively stable.
- Arrows highlight critical transitions (e.g., a sharp drop at ~50 and a recovery at ~70).
- **Uncertainty**: No numerical values provided; trends are inferred from visual inspection.
#### (c) Network Partitioning
- The "cut" at time = 35 divides the network into two subgraphs:
- **Left Subgraph (time < 35)**: Nodes 1–15 are fully connected.
- **Right Subgraph (time > 35)**: Nodes 1–15 remain connected, but the cut line suggests a threshold for partitioning.
- **OIM Label**: Likely refers to "Optimal Information Measure" or a similar metric, indicating a critical point in the network's structure.
---
### Key Observations
1. **Sampling Sequence**: The oscillator cycles through 15 states with a repeating pattern, suggesting periodic or quasi-periodic behavior.
2. **Phase Dynamics**: The system exhibits oscillatory behavior with varying stability across parameters (FHI⁰, Kₛ).
3. **Network Partitioning**: The cut at time = 35 may represent a critical threshold for network connectivity or information flow.
---
### Interpretation
- **System Behavior**: The oscillator's dynamics (φ(π)) are influenced by parameters FHI⁰ and Kₛ. The sampling sequence and phase dynamics suggest a balance between stability and variability.
- **Network Criticality**: The OIM cut at time = 35 implies a phase transition or bifurcation in the network's structure, potentially marking a shift in system behavior.
- **Uncertainty**: The absence of numerical data limits precise quantification of trends. Further analysis would require explicit values for φ(π) and transition probabilities.