## Heatmap: Performance vs. Number of Feedback Repairs and Initial Programs
### Overview
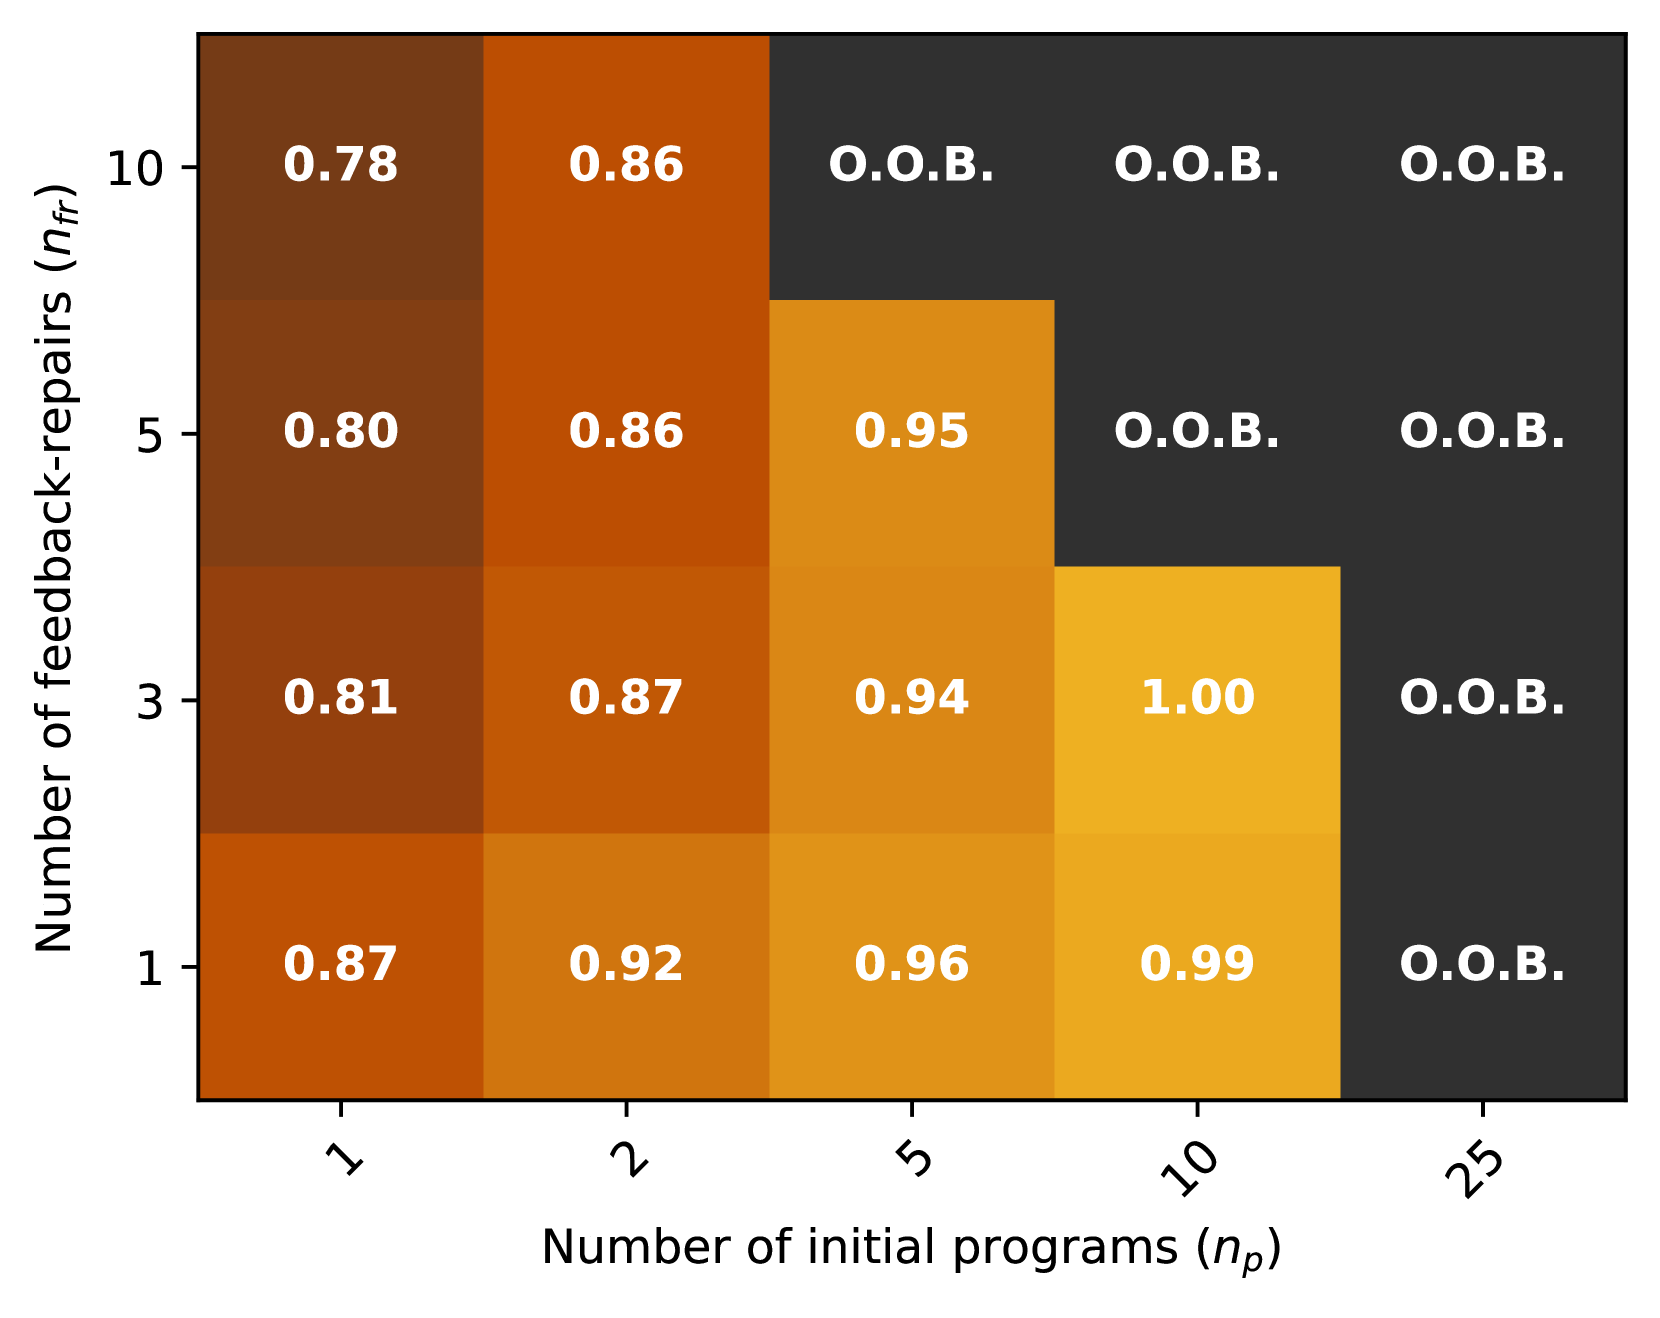
The image is a heatmap visualizing performance (represented by color intensity and numerical values) as a function of two variables: the number of feedback repairs (nfr) and the number of initial programs (np). The heatmap shows how performance changes as these two parameters are varied. "O.O.B." is present in the heatmap, likely indicating "Out of Bounds" or a similar condition where a value is not applicable or available.
### Components/Axes
* **Y-axis (Vertical):** "Number of feedback-repairs (nfr)". Values: 1, 3, 5, 10.
* **X-axis (Horizontal):** "Number of initial programs (np)". Values: 1, 2, 5, 10, 25.
* **Cells:** Each cell in the heatmap represents a combination of nfr and np. The color of the cell indicates the performance value, with darker shades of brown representing lower values and lighter shades of yellow representing higher values. The numerical value is displayed within each cell.
* **Color Scale:** The color scale is implicit, with darker browns indicating lower values and lighter yellows indicating higher values. Dark gray indicates "O.O.B."
### Detailed Analysis
Here's a breakdown of the values in the heatmap:
| nfr \ np | 1 | 2 | 5 | 10 | 25 |
| :------- | :--- | :--- | :--- | :--- | :--- |
| 10 | 0.78 | 0.86 | O.O.B. | O.O.B. | O.O.B. |
| 5 | 0.80 | 0.86 | 0.95 | O.O.B. | O.O.B. |
| 3 | 0.81 | 0.87 | 0.94 | 1.00 | O.O.B. |
| 1 | 0.87 | 0.92 | 0.96 | 0.99 | O.O.B. |
**Observations:**
* **Trend with increasing np (for a fixed nfr):** For a fixed number of feedback repairs (nfr), the performance generally increases as the number of initial programs (np) increases, up to a point. After np=10, the values are "O.O.B."
* **Trend with increasing nfr (for a fixed np):** For a fixed number of initial programs (np), the performance generally decreases as the number of feedback repairs (nfr) increases.
* **"O.O.B." Values:** All values for np = 25 are "O.O.B.". Also, for np = 10, the values are "O.O.B." when nfr is 5 or 10. For np = 5, the value is "O.O.B." when nfr is 10.
* **Best Performance:** The highest performance value (1.00) is achieved when nfr = 3 and np = 10.
* **Worst Performance:** The lowest performance value (0.78) is achieved when nfr = 10 and np = 1.
### Key Observations
* Performance tends to improve with more initial programs (np), but only up to a certain point.
* Increasing the number of feedback repairs (nfr) does not always improve performance and can sometimes decrease it.
* The "O.O.B." values suggest that certain combinations of nfr and np are not feasible or result in undefined behavior.
### Interpretation
The heatmap suggests that there is an optimal balance between the number of feedback repairs and the number of initial programs. Increasing the number of initial programs generally improves performance, likely because it provides a larger search space for finding better solutions. However, increasing the number of feedback repairs can sometimes degrade performance, possibly due to overfitting or getting stuck in local optima. The "O.O.B." values indicate limitations in the experimental setup or algorithm, where certain combinations of parameters are not valid or lead to errors. The best performance is achieved with a moderate number of feedback repairs (nfr = 3) and a relatively high number of initial programs (np = 10).