\n
## Heatmap: Feedback-Repairs Performance
### Overview
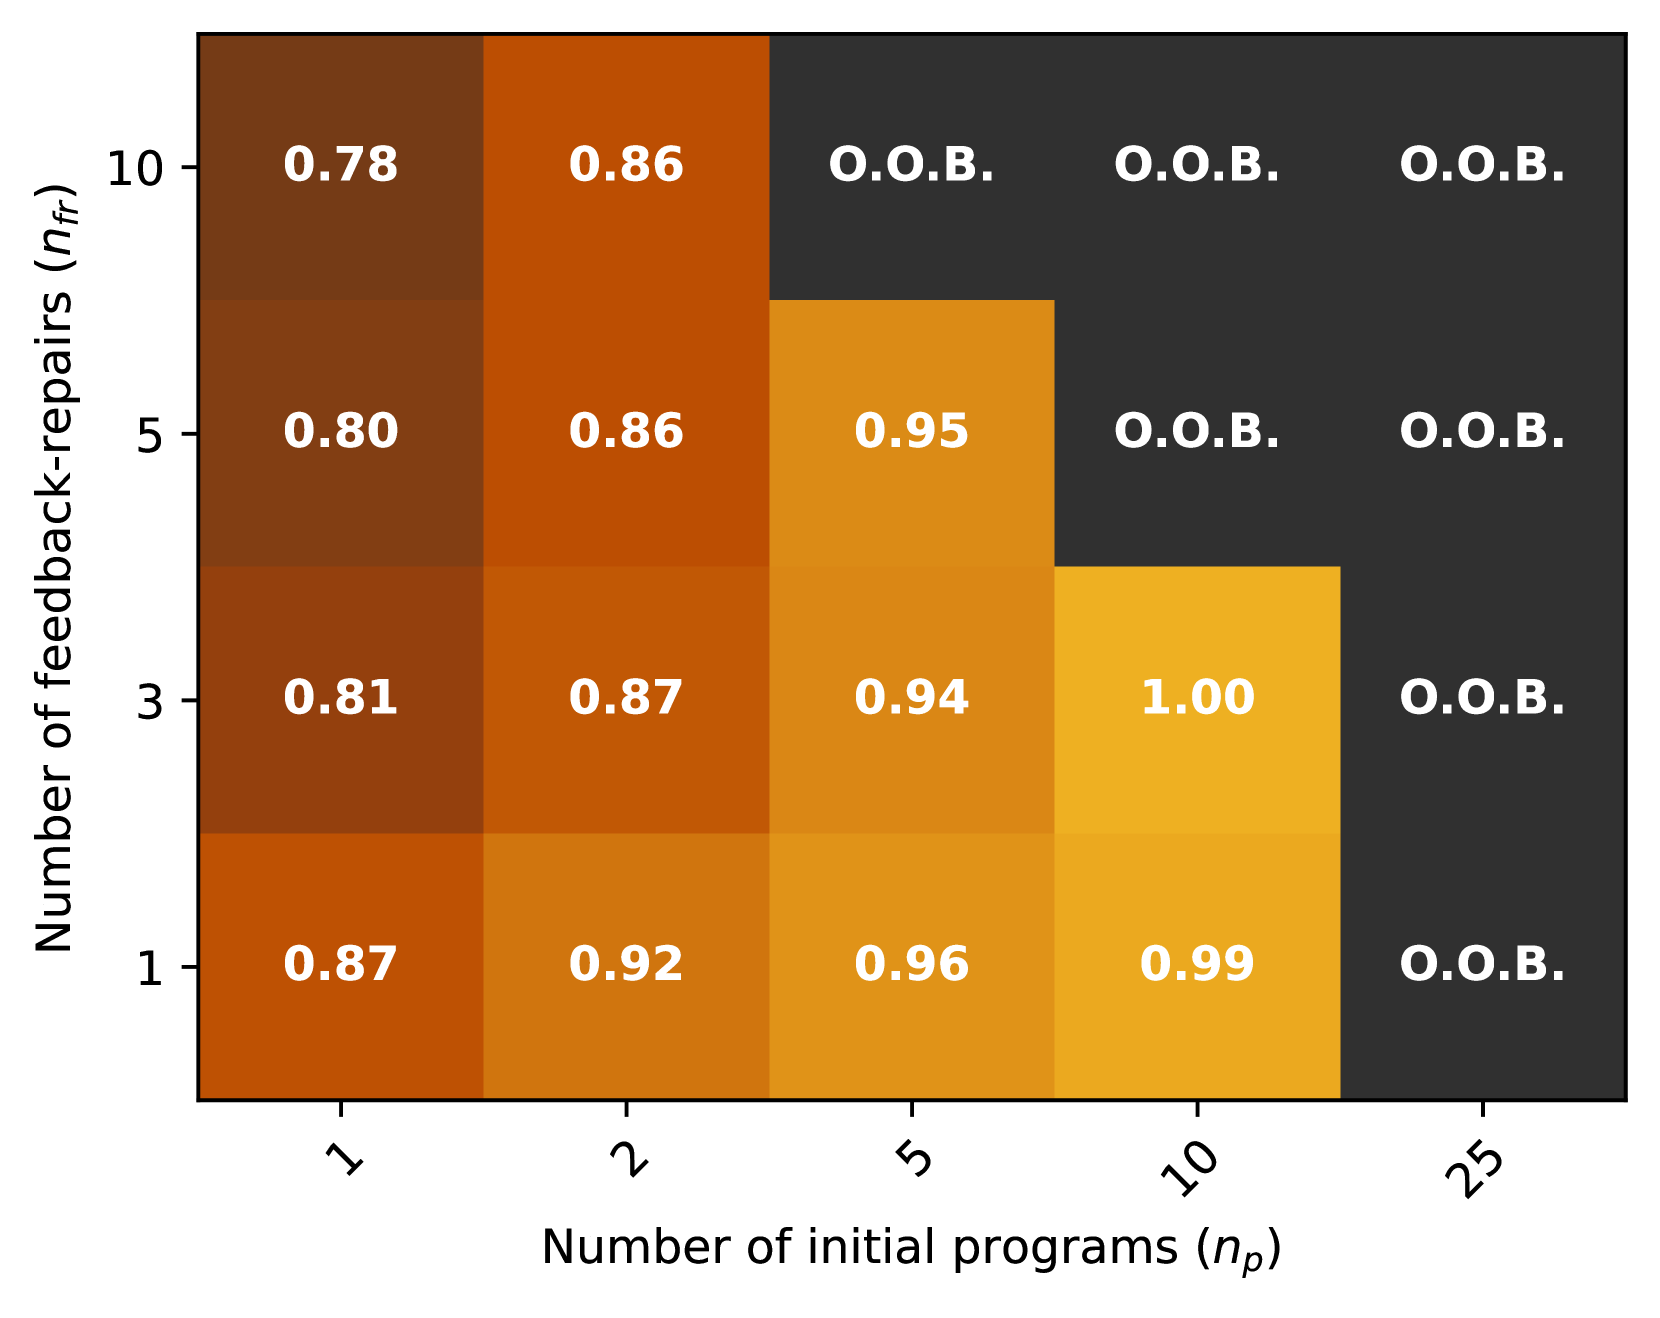
This image presents a heatmap visualizing the performance of feedback-repairs based on the number of initial programs (np) and the number of feedback-repairs (nf). The performance is represented by numerical values ranging from approximately 0.78 to 1.00, with "O.O.B." indicating values that are Out Of Bounds. The heatmap uses a color gradient from dark brown to bright yellow, where darker colors represent lower performance values and brighter colors represent higher performance values.
### Components/Axes
* **X-axis:** Number of initial programs (np) with markers at 1, 2, 5, 10, and 25.
* **Y-axis:** Number of feedback-repairs (nf) with markers at 1, 3, 5, and 10.
* **Color Scale:** A gradient from dark brown (low values) to bright yellow (high values).
* **Data Labels:** Numerical values are displayed within each cell of the heatmap.
* **Out-of-Bounds Indicator:** "O.O.B." is used to denote values that fall outside the defined range.
### Detailed Analysis
The heatmap displays the following data points:
* **np = 1:**
* nf = 1: 0.87
* nf = 3: 0.81
* nf = 5: 0.80
* nf = 10: 0.78
* **np = 2:**
* nf = 1: 0.92
* nf = 3: 0.87
* nf = 5: 0.86
* nf = 10: 0.86
* **np = 5:**
* nf = 1: 0.96
* nf = 3: 0.94
* nf = 5: 0.95
* nf = 10: O.O.B.
* **np = 10:**
* nf = 1: 0.99
* nf = 3: 1.00
* nf = 5: O.O.B.
* nf = 10: O.O.B.
* **np = 25:**
* nf = 1: O.O.B.
* nf = 3: O.O.B.
* nf = 5: O.O.B.
* nf = 10: O.O.B.
The values generally increase as the number of initial programs (np) increases from 1 to 10, and as the number of feedback-repairs (nf) increases from 1 to 5. However, beyond np = 10, all values are marked as "O.O.B.".
### Key Observations
* The highest performance value (1.00) is achieved when np = 10 and nf = 3.
* Performance degrades significantly (indicated by "O.O.B.") when np is 25, regardless of the number of feedback-repairs.
* The performance is relatively stable for low values of np (1 and 2) across different values of nf.
* There is a clear trend of increasing performance with increasing np up to a certain point (np = 10).
### Interpretation
The data suggests that feedback-repairs are most effective when a moderate number of initial programs are used (around 10). Increasing the number of initial programs beyond this point leads to out-of-bounds results, indicating that the method becomes unstable or invalid. The "O.O.B." values could represent a saturation point where the feedback-repair mechanism is no longer able to effectively improve the programs, or that the underlying model breaks down. The increasing performance with increasing np up to 10 suggests that a larger initial program set provides more opportunities for effective feedback and repair. The heatmap demonstrates a trade-off between the number of initial programs and the effectiveness of feedback-repairs, highlighting the importance of finding an optimal balance for achieving high performance. The data implies that the feedback-repair process has limitations and is not universally applicable to arbitrarily large sets of initial programs.