## Heatmap: Performance vs. Initial Programs and Feedback-Repairs
### Overview
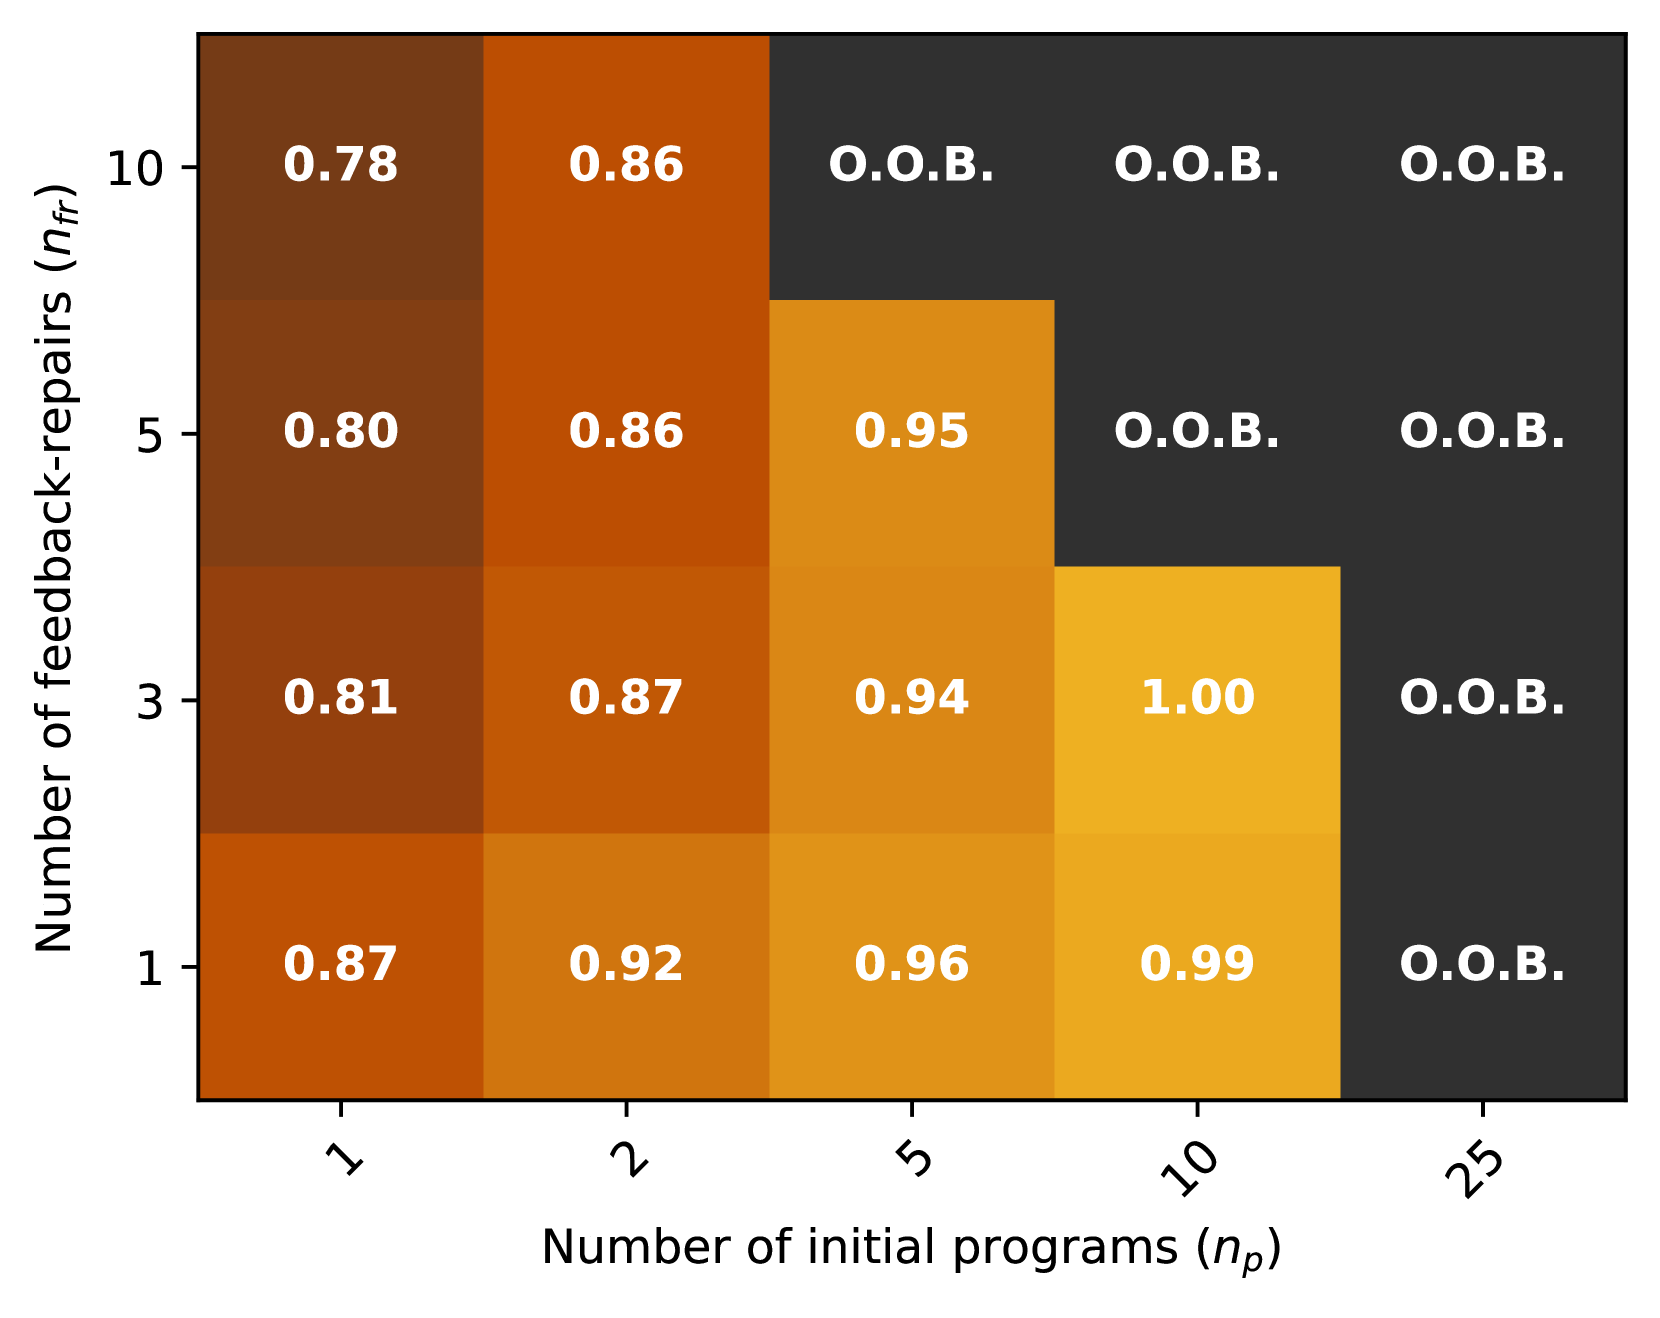
The image is a heatmap chart visualizing a performance metric (likely a success rate or score, ranging from 0.78 to 1.00) as a function of two variables: the "Number of initial programs (n_p)" on the x-axis and the "Number of feedback-repairs (n_fr)" on the y-axis. Cells are colored on a gradient from dark brown (lower values) to bright yellow (higher values). A distinct dark gray color is used for cells labeled "O.O.B.", indicating an "Out of Bounds" or invalid condition.
### Components/Axes
* **Chart Type:** Heatmap (2D grid).
* **X-Axis (Horizontal):**
* **Label:** "Number of initial programs (n_p)"
* **Categories/Markers (from left to right):** 1, 2, 5, 10, 25.
* **Y-Axis (Vertical):**
* **Label:** "Number of feedback-repairs (n_fr)"
* **Categories/Markers (from bottom to top):** 1, 3, 5, 10.
* **Data Representation:** Each cell contains a numerical value (to two decimal places) or the text "O.O.B.".
* **Color Scale:** A sequential color gradient is used for valid numerical values:
* Dark Brown: Lower values (~0.78-0.81)
* Orange-Brown: Mid-range values (~0.86-0.92)
* Golden Yellow: Higher values (~0.94-1.00)
* Dark Gray: "O.O.B." cells.
### Detailed Analysis
The heatmap presents a 4x5 grid of data points. The following table reconstructs the data, with rows representing `n_fr` (y-axis) and columns representing `n_p` (x-axis).
| n_fr \ n_p | 1 | 2 | 5 | 10 | 25 |
| :--------- | :--- | :--- | :--- | :--- | :--- |
| **10** | 0.78 | 0.86 | O.O.B. | O.O.B. | O.O.B. |
| **5** | 0.80 | 0.86 | 0.95 | O.O.B. | O.O.B. |
| **3** | 0.81 | 0.87 | 0.94 | 1.00 | O.O.B. |
| **1** | 0.87 | 0.92 | 0.96 | 0.99 | O.O.B. |
**Trend Verification:**
* **Horizontal Trend (Increasing n_p):** For a fixed number of feedback-repairs (`n_fr`), the performance value generally **increases** as the number of initial programs (`n_p`) increases, until it hits the "O.O.B." boundary. For example, at `n_fr=1`, the value rises from 0.87 (n_p=1) to 0.99 (n_p=10).
* **Vertical Trend (Increasing n_fr):** For a fixed number of initial programs (`n_p`), the performance value generally **decreases** as the number of feedback-repairs (`n_fr`) increases. For example, at `n_p=1`, the value falls from 0.87 (n_fr=1) to 0.78 (n_fr=10).
* **"O.O.B." Region:** The "Out of Bounds" condition forms a clear triangular region in the top-right of the heatmap. It occurs for all combinations where `n_p=25`, and expands to include lower `n_p` values as `n_fr` increases (e.g., at `n_fr=10`, `n_p=5,10,25` are O.O.B.).
### Key Observations
1. **Peak Performance:** The highest recorded value is **1.00**, located at the intersection of `n_p=10` and `n_fr=3`.
2. **Performance Floor:** The lowest recorded valid value is **0.78**, at `n_p=1` and `n_fr=10`.
3. **"O.O.B." Boundary:** The system or model being measured appears to have an operational limit. The "O.O.B." region suggests that combinations of high initial programs and high feedback-repairs are invalid, computationally infeasible, or lead to failure. The boundary is not a simple linear cutoff but a stepped, diagonal frontier.
4. **Color-Value Correlation:** The color gradient accurately reflects the numerical values, with the brightest yellow (1.00) corresponding to the highest score and the darkest brown (0.78) to the lowest valid score.
### Interpretation
This heatmap likely illustrates the performance of an iterative program repair or synthesis system. The data suggests a nuanced relationship between initial diversity (`n_p`) and iterative correction (`n_fr`):
* **Benefit of Initial Diversity:** Increasing the number of initial program candidates (`n_p`) consistently improves the success metric, up to a point. This implies that starting with more diverse guesses increases the chance of finding or converging on a correct solution.
* **Cost of Excessive Repair:** Increasing the number of feedback-repair cycles (`n_fr`) for a given set of initial programs tends to slightly degrade the final performance score. This could indicate overfitting to the feedback, introduction of new errors, or diminishing returns where later repairs are less effective.
* **The "O.O.B." Constraint:** The critical insight is the operational boundary. The system cannot handle (or is not tested on) scenarios requiring both a very large pool of initial programs (`n_p=25`) and any significant number of repairs. Furthermore, as the repair budget (`n_fr`) increases, the maximum viable number of initial programs decreases. This points to a resource constraint (like memory or time) where the computational cost scales with the product of `n_p` and `n_fr`, making high values in both dimensions prohibitive.
* **Optimal Zone:** The "sweet spot" for performance appears to be in the central region of the valid grid, specifically around `n_p=5-10` and `n_fr=1-3`, where scores are highest (0.94-1.00) and the system is operating within its bounds. The chart effectively maps the trade-off between exploration (more initial programs) and exploitation (more repair cycles) within the system's computational limits.