## Heatmap: Relationship Between Feedback-Repairs and Initial Programs
### Overview
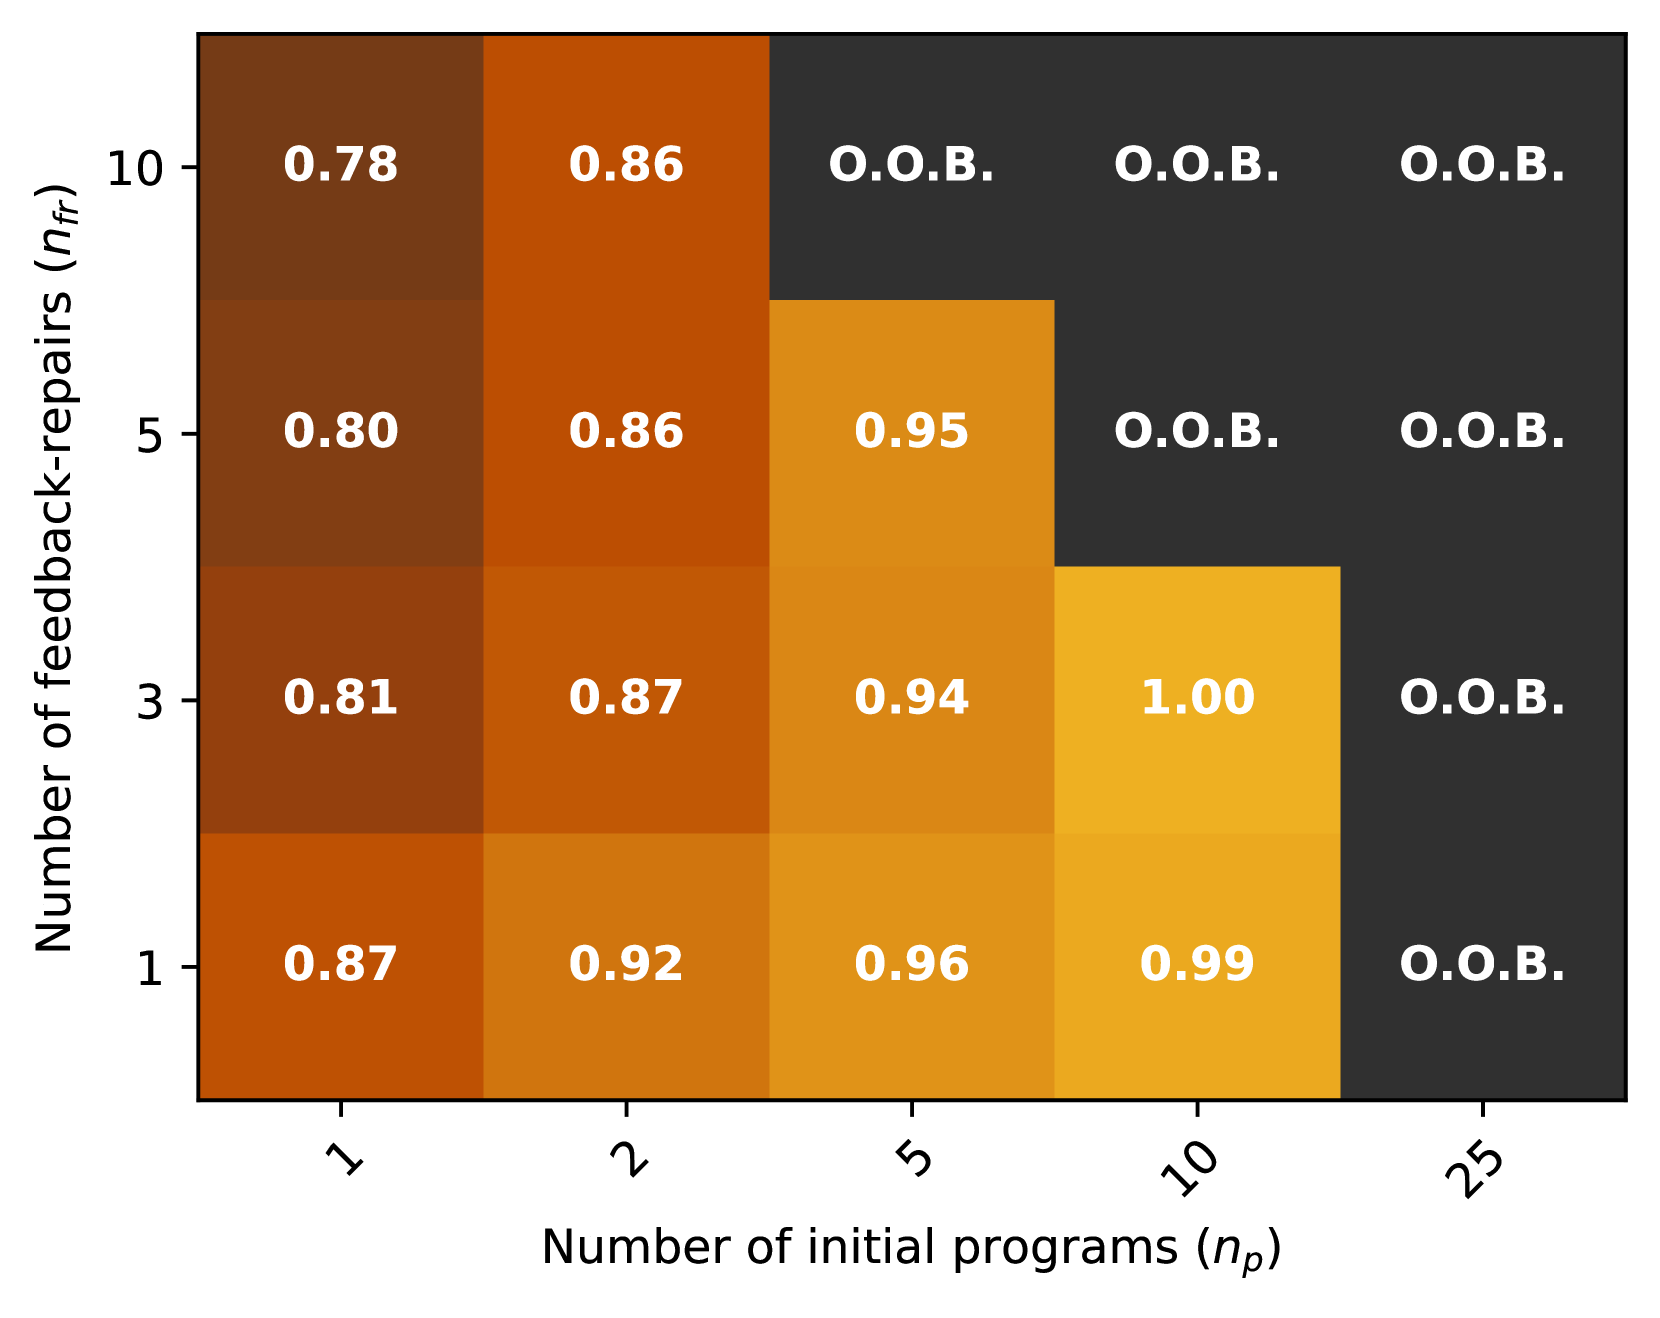
The image is a heatmap visualizing the relationship between the number of feedback-repairs (`n_fr`) and the number of initial programs (`n_p`). Values are represented by color intensity (dark brown to black) and numerical labels, with "O.O.B." indicating out-of-bounds or undefined data.
---
### Components/Axes
- **X-axis (Horizontal)**:
- Label: "Number of initial programs (`n_p`)"
- Categories: 1, 2, 5, 10, 25
- **Y-axis (Vertical)**:
- Label: "Number of feedback-repairs (`n_fr`)"
- Categories: 1, 3, 5, 10
- **Color Legend**:
- Dark brown → Black gradient represents increasing values (0.78 to 1.00).
- Black cells labeled "O.O.B." denote undefined or non-applicable data.
---
### Detailed Analysis
#### Cell Values and Trends
1. **`n_p = 1`**:
- `n_fr = 1`: 0.87 (dark brown)
- `n_fr = 3`: 0.81 (medium brown)
- `n_fr = 5`: 0.80 (dark brown)
- `n_fr = 10`: 0.78 (darkest brown)
2. **`n_p = 2`**:
- `n_fr = 1`: 0.92 (medium orange)
- `n_fr = 3`: 0.87 (medium brown)
- `n_fr = 5`: 0.86 (dark brown)
- `n_fr = 10`: 0.86 (dark brown)
3. **`n_p = 5`**:
- `n_fr = 1`: 0.96 (light orange)
- `n_fr = 3`: 0.94 (medium orange)
- `n_fr = 5`: 0.95 (light orange)
- `n_fr = 10`: O.O.B. (black)
4. **`n_p = 10`**:
- `n_fr = 1`: 0.99 (bright yellow)
- `n_fr = 3`: 1.00 (brightest yellow)
- `n_fr = 5`: O.O.B. (black)
- `n_fr = 10`: O.O.B. (black)
5. **`n_p = 25`**:
- All `n_fr` values: O.O.B. (black)
---
### Key Observations
1. **Increasing Trends**:
- Values generally increase with higher `n_p` and `n_fr` until reaching thresholds (e.g., `n_p = 10`, `n_fr = 3`).
- The maximum value (1.00) occurs at `n_p = 10`, `n_fr = 3`.
2. **Thresholds**:
- Beyond `n_p = 10`, all values become O.O.B., suggesting a system limit or undefined behavior.
- For `n_p = 5`, `n_fr = 10` is O.O.B., indicating a secondary threshold.
3. **Color Consistency**:
- Darker colors (brown/black) correlate with lower values, while lighter colors (yellow) indicate higher values.
- "O.O.B." entries are uniformly black, confirming their exclusion from the value gradient.
---
### Interpretation
- **Optimal Range**: The highest performance (value = 1.00) occurs at `n_p = 10` and `n_fr = 3`, suggesting this combination maximizes the measured metric (e.g., efficiency, success rate).
- **Diminishing Returns**: Values plateau or drop slightly at higher `n_fr` for fixed `n_p` (e.g., `n_p = 2`, `n_fr = 5` vs. `n_fr = 10`).
- **System Limits**: The O.O.B. entries at `n_p ≥ 10` imply the system cannot handle more than 10 initial programs, or the metric becomes undefined beyond this point.
- **Practical Implications**: Resource allocation should prioritize `n_p ≤ 10` and `n_fr ≤ 3` to avoid undefined outcomes. Scaling beyond these limits may require system redesign.
---
### Spatial Grounding
- **Legend**: Implied by color gradient (no explicit legend box).
- **Text Placement**: Numerical values are centered in cells; "O.O.B." labels are in black text within black cells.
- **Axis Alignment**: Categories are evenly spaced along axes, with labels positioned outside the plot area.
---
### Final Notes
The heatmap reveals a clear trade-off between scaling initial programs and feedback-repairs. While increasing both improves performance up to a point, exceeding thresholds (`n_p > 10`) leads to system failure or undefined behavior. This highlights the importance of balancing resource allocation within operational limits.