## Image Sequence: Visualization of Attention Maps
### Overview
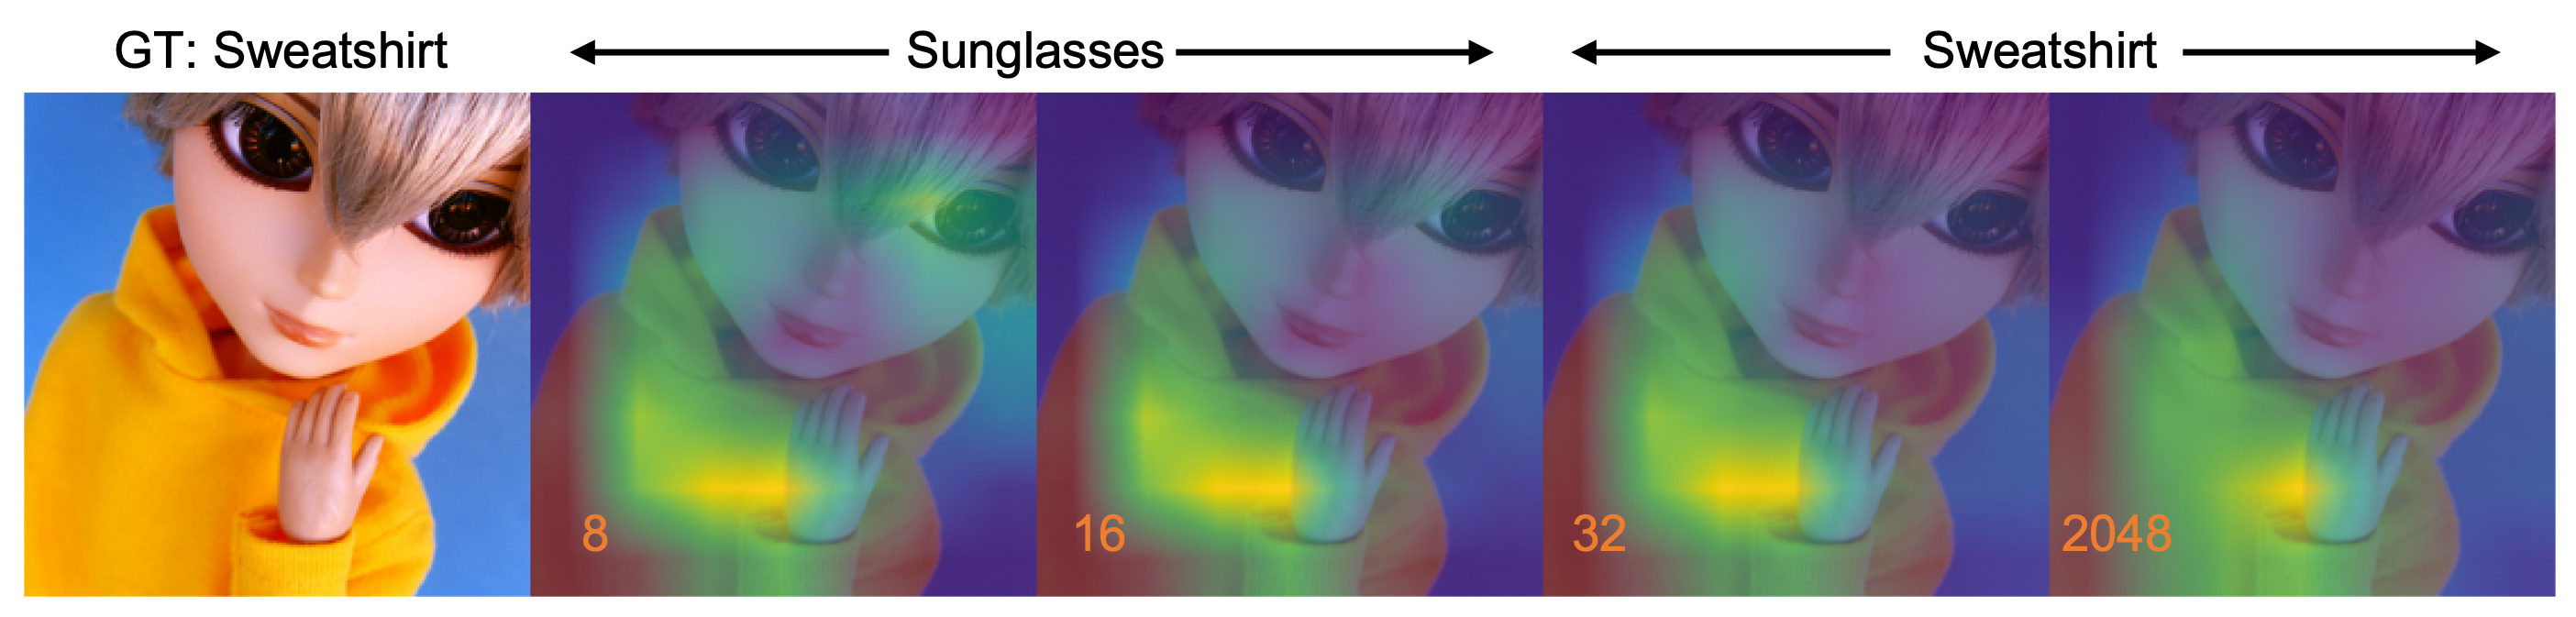
The image displays a sequence of five visualizations of a doll wearing a yellow sweatshirt, with progressive changes in visual effects. The sequence includes a ground truth (GT) image, followed by four heatmap-style representations labeled with numbers (8, 16, 32, 2048). Arrows indicate relationships between "GT: Sweatshirt," "Sunglasses," and "Sweatshirt," suggesting a progression or transformation process.
### Components/Axes
- **Labels**:
- "GT: Sweatshirt" (ground truth reference)
- "Sunglasses" (left arrow)
- "Sweatshirt" (right arrow)
- **Numbers**:
- 8, 16, 32, 2048 (exponentially increasing values, likely representing scale or intensity)
- **Color Gradient**:
- Blue (low intensity) → Green (medium) → Yellow (high intensity), indicating attention or activation levels.
### Detailed Analysis
1. **GT: Sweatshirt (Leftmost Image)**:
- A doll with short blonde hair, large eyes, and a yellow sweatshirt against a blue background.
- No visual effects; serves as a baseline reference.
2. **Sunglasses (Second Image, Number 8)**:
- Overlay of green/yellow heatmap on the doll’s face and sweatshirt.
- Brightest intensity on the sunglasses area (yellow), fading to green on the sweatshirt.
3. **Sweatshirt (Third Image, Number 16)**:
- Similar heatmap but with broader coverage.
- Sweatshirt area shows stronger yellow intensity, while sunglasses remain localized.
4. **Sweatshirt (Fourth Image, Number 32)**:
- Heatmap expands further, with yellow dominating the sweatshirt and fading to green on the face.
- Background transitions to purple, suggesting reduced attention to non-target regions.
5. **Sweatshirt (Fifth Image, Number 2048)**:
- Most intense heatmap, with yellow concentrated on the sweatshirt and minimal green on the face.
- Background remains purple, emphasizing focus on the target object.
### Key Observations
- **Exponential Scaling**: Numbers (8, 16, 32, 2048) follow powers of 2, suggesting logarithmic scaling of attention or model parameters.
- **Attention Localization**:
- Lower values (8, 16) show mixed focus on sunglasses and sweatshirt.
- Higher values (32, 2048) concentrate attention on the sweatshirt, aligning with the "Sweatshirt" label.
- **Color Correlation**:
- Yellow corresponds to highest intensity (target regions).
- Green indicates moderate attention (secondary regions).
- Blue/Purple represents low/no attention (background).
### Interpretation
The sequence visualizes how an attention mechanism in a computational model (e.g., neural network) prioritizes specific regions (sunglasses and sweatshirt) as the scale increases. The ground truth (GT) establishes the target object (sweatshirt), while the heatmaps demonstrate the model’s ability to isolate and focus on this object. The exponential increase in numbers (8 → 2048) likely reflects iterative refinement or parameter adjustments, with higher values enabling sharper localization. The transition from mixed attention (sunglasses/sweatshirt) to singular focus (sweatshirt) suggests the model learns to prioritize the GT label over distractors. This could relate to tasks like object segmentation, where attention maps guide the model to distinguish foreground from background.