## Line Chart: Exact Match vs. SFT Data Ratio
### Overview
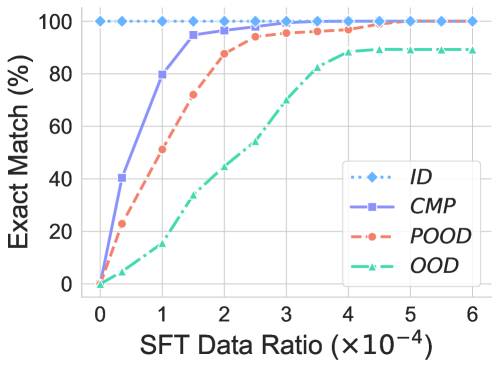
This chart illustrates the performance, measured as "Exact Match (%)", of four distinct data categories (ID, CMP, POOD, OOD) as the "SFT Data Ratio" increases. The chart demonstrates how different types of data influence model accuracy during Supervised Fine-Tuning (SFT).
### Components/Axes
* **Y-Axis:** Labeled "Exact Match (%)". The scale ranges from 0 to 100, with grid lines at intervals of 20.
* **X-Axis:** Labeled "SFT Data Ratio ($\times 10^{-4}$)". The scale ranges from 0 to 6, with grid lines at intervals of 1.
* **Legend:** Positioned in the bottom-right quadrant of the chart area.
* **ID**: Blue dotted line with diamond markers.
* **CMP**: Purple solid line with square markers.
* **POOD**: Orange-red dashed line with circle markers.
* **OOD**: Teal dash-dot line with triangle markers.
### Detailed Analysis
The chart displays four distinct learning curves, all starting at (0,0) except for the ID series.
* **ID (In-Distribution):**
* **Trend:** This series is a flat horizontal line at 100%.
* **Values:** Remains constant at 100% across the entire X-axis range (0 to 6).
* **CMP (Comparison/Compositional):**
* **Trend:** A steep, upward-sloping curve that exhibits rapid growth before plateauing.
* **Values:**
* At x=0.5: ~40%
* At x=1.0: ~80%
* At x=1.5: ~95%
* At x=2.0: ~97%
* Plateaus near 100% after x=3.0.
* **POOD (Possibly Out-of-Distribution):**
* **Trend:** A moderate, upward-sloping curve that grows steadily and plateaus later than CMP.
* **Values:**
* At x=0.5: ~23%
* At x=1.0: ~52%
* At x=1.5: ~72%
* At x=2.0: ~88%
* At x=2.5: ~94%
* At x=3.0: ~96%
* Reaches ~100% near x=5.0.
* **OOD (Out-of-Distribution):**
* **Trend:** The slowest rising curve, showing a gradual, concave-downward growth pattern.
* **Values:**
* At x=0.5: ~5%
* At x=1.0: ~15%
* At x=1.5: ~33%
* At x=2.0: ~45%
* At x=2.5: ~55%
* At x=3.0: ~70%
* At x=3.5: ~83%
* At x=4.0: ~88%
* Plateaus at approximately 90% from x=4.0 onwards.
### Key Observations
* **Performance Hierarchy:** The model's ability to achieve an "Exact Match" is strictly ordered by category: ID > CMP > POOD > OOD.
* **Data Efficiency:** The ID category requires zero additional SFT data to achieve perfect accuracy, suggesting the model was already proficient in this domain.
* **Generalization Gap:** There is a significant performance gap between ID/CMP tasks and OOD tasks. While CMP and POOD eventually reach near-perfect accuracy with enough data, the OOD category plateaus at ~90%, indicating a potential limitation in the model's ability to generalize to out-of-distribution data regardless of the SFT data ratio provided.
### Interpretation
This chart is a classic representation of model adaptation during fine-tuning.
* **ID (In-Distribution)** represents the model's baseline capability; it is already "solved" or highly familiar to the model.
* **CMP and POOD** represent tasks that are within the model's reach; they require some fine-tuning data to "unlock" the correct behavior, but they converge to high accuracy relatively quickly.
* **OOD (Out-of-Distribution)** represents the "hard" tasks. The slow, shallow slope suggests that the model struggles to map the SFT data to the correct outputs for these inputs. The fact that it plateaus at ~90% suggests that either the model lacks the capacity to fully learn these OOD patterns, or the OOD data is inherently noisy/ambiguous compared to the other categories.
In a technical context, this suggests that if the goal is to improve OOD performance, simply increasing the SFT data ratio (within this range) may yield diminishing returns, and architectural changes or different training strategies might be required.