## Line Graph: Exact Match Performance vs. SFT Data Ratio
### Overview
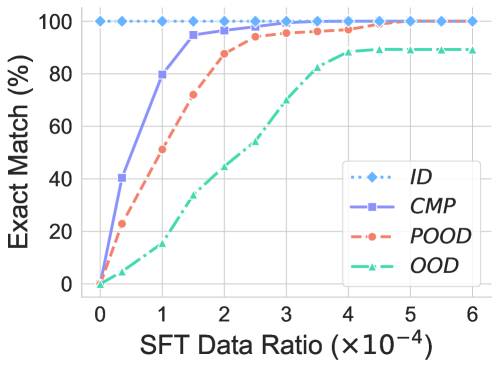
The graph illustrates the relationship between the SFT Data Ratio (scaled by ×10⁻⁴) and the Exact Match (%) performance of four distinct methods: ID, CMP, POOD, and OOD. Performance is measured as a percentage, with all methods plateauing near 100% at higher data ratios.
### Components/Axes
- **X-axis**: SFT Data Ratio (×10⁻⁴), ranging from 0 to 6 in increments of 1.
- **Y-axis**: Exact Match (%), ranging from 0 to 100% in increments of 20.
- **Legend**: Located in the bottom-right corner, mapping:
- Blue diamonds (dashed line): ID
- Purple squares (solid line): CMP
- Red circles (dashed line): POOD
- Green triangles (dashed line): OOD
### Detailed Analysis
1. **ID (Blue Diamonds)**:
- Starts at 0% at x=0.
- Rises sharply to 100% by x=1.
- Remains flat at 100% for x ≥ 1.
2. **CMP (Purple Squares)**:
- Begins at 0% at x=0.
- Increases gradually, reaching 100% by x=2.
- Plateaus at 100% for x ≥ 2.
3. **POOD (Red Circles)**:
- Starts at 0% at x=0.
- Rises steadily, surpassing CMP around x=2.
- Reaches 100% by x=4 and plateaus.
4. **OOD (Green Triangles)**:
- Begins at 0% at x=0.
- Increases slowly, reaching ~85% by x=6.
- Stabilizes near 85% for x ≥ 6.
### Key Observations
- **Early Performance**: ID achieves 100% performance fastest (x=1), followed by CMP (x=2) and POOD (x=4).
- **Late-Stage Growth**: OOD lags significantly, only reaching ~85% by x=6.
- **Crossing Trends**: POOD overtakes CMP between x=2 and x=3, indicating superior performance at higher data ratios.
- **Plateaus**: All methods plateau near 100% except OOD, which plateaus at ~85%.
### Interpretation
The graph suggests that **ID** is the most efficient method, achieving full performance with minimal data. **CMP** and **POOD** show similar trajectories but diverge at higher ratios, with POOD outperforming CMP beyond x=3. **OOD** demonstrates the weakest performance, requiring the largest data ratio to reach ~85% and failing to match the others. This could reflect differences in algorithmic efficiency, data utilization, or model architecture. The plateauing behavior implies diminishing returns beyond certain data ratios, highlighting a potential threshold for optimal performance.