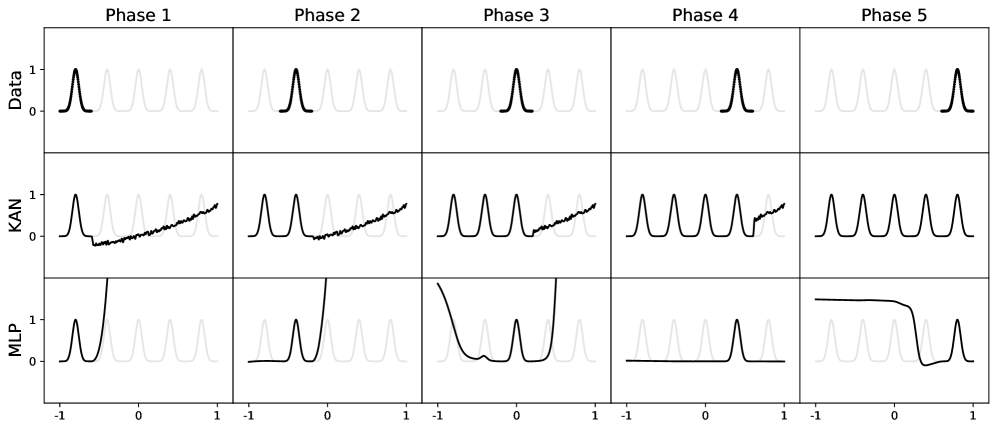
## Line Graph Grid: Phase Analysis Across Three Datasets
### Overview
The image displays a 3x5 grid of line graphs comparing three datasets (Data, KAN, MLP) across five phases (Phase 1-5). Each row represents a distinct dataset, while columns represent sequential phases. All graphs share identical axes: x-axis from -1 to 1 and y-axis from 0 to 1. The graphs exhibit distinct temporal patterns with varying amplitudes, frequencies, and stability.
### Components/Axes
- **Rows (Datasets)**:
- Top row: "Data" (black line)
- Middle row: "KAN" (black line)
- Bottom row: "MLP" (black line)
- **Columns (Phases)**:
- Phase 1 (leftmost) to Phase 5 (rightmost)
- **Axes**:
- X-axis: -1 to 1 (linear scale)
- Y-axis: 0 to 1 (linear scale)
- **Visual Elements**:
- Gray shaded background in all subplots
- No explicit legend (dataset labels inferred from row positions)
### Detailed Analysis
#### Phase 1
- **Data**: Sharp peak at x=0 (y≈0.8), rapid decay to baseline
- **KAN**: Gradual increase from x=-1 (y≈0.2) to x=1 (y≈0.6)
- **MLP**: Single peak at x=-1 (y≈0.9), immediate drop to baseline
#### Phase 2
- **Data**: Peak at x=-0.5 (y≈0.7), narrower than Phase 1
- **KAN**: Two oscillations (peaks at x=-0.7 and x=0.3, y≈0.5)
- **MLP**: Double-peak structure (x=-0.8 and x=0.2, y≈0.8)
#### Phase 3
- **Data**: Peak at x=0 (y≈0.6), symmetrical decay
- **KAN**: Three oscillations (peaks at x=-0.9, 0, 0.9, y≈0.7)
- **MLP**: Single wide peak spanning x=-0.5 to 0.5 (y≈0.7)
#### Phase 4
- **Data**: Peak at x=0.5 (y≈0.5), asymmetric decay
- **KAN**: Four oscillations (peaks at x=-0.8, -0.2, 0.4, 0.8, y≈0.8)
- **MLP**: Narrow peak at x=0.3 (y≈0.6), rapid drop
#### Phase 5
- **Data**: Peak at x=1 (y≈0.4), minimal amplitude
- **KAN**: Five oscillations (peaks at x=-0.7, -0.1, 0.3, 0.7, 1.0, y≈0.9)
- **MLP**: Flat baseline with single spike at x=0.8 (y≈0.5)
### Key Observations
1. **Data Series**:
- Peak amplitude decreases by ~0.1 per phase (0.8 → 0.4)
- Peak position shifts rightward across phases
- Decay rate increases in later phases
2. **KAN Series**:
- Oscillation count increases by 1 per phase (1 → 5)
- Amplitude grows from 0.2 → 0.9
- Phase 5 shows sustained oscillations to x=1
3. **MLP Series**:
- Transitions from single peaks to complex patterns
- Phase 5 exhibits abrupt threshold behavior (flat → spike)
- Amplitude stabilizes at ~0.5-0.6 in later phases
### Interpretation
The grid suggests a comparative analysis of system behavior across phases:
- **Data** represents a decaying signal with shifting characteristics
- **KAN** demonstrates increasing complexity and amplitude, possibly modeling adaptive behavior
- **MLP** shows evolving decision boundaries with threshold-like transitions
Notable anomalies include MLP's abrupt Phase 5 transition (potential classification boundary) and KAN's sustained oscillations in Phase 5 (possible resonance effect). The consistent gray background across all plots suggests controlled experimental conditions. The absence of a formal legend implies row position encodes dataset identity, requiring careful spatial grounding for interpretation.