## Bar Charts: Question and Answer Token Frequency Distribution
### Overview
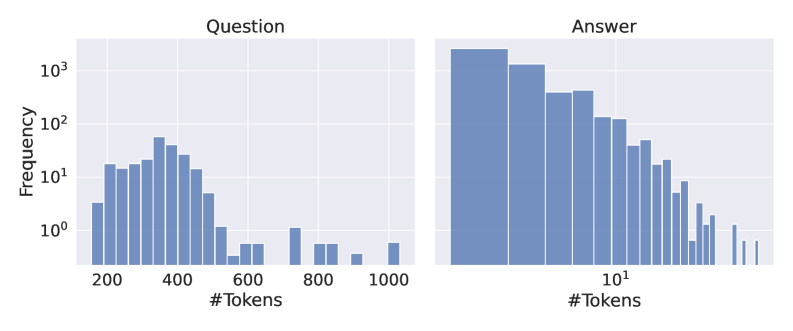
The image contains two side-by-side bar charts comparing token frequency distributions for "Questions" (left) and "Answers" (right). Both charts use a logarithmic y-axis scale (10⁰ to 10³) and display frequency distributions across different token counts. The charts reveal distinct patterns in text length distributions for questions versus answers.
### Components/Axes
**Left Chart (Question):**
- **X-axis**: "#Tokens" (linear scale: 200 → 1000)
- **Y-axis**: "Frequency" (log scale: 10⁰ → 10³)
- **Bars**: Blue vertical bars representing frequency counts
**Right Chart (Answer):**
- **X-axis**: "#Tokens" (log scale: 10¹ → 10³)
- **Y-axis**: "Frequency" (log scale: 10⁰ → 10³)
- **Bars**: Blue vertical bars representing frequency counts
**Shared Elements:**
- Grid lines at 10x intervals on y-axis
- No explicit legend (charts are separated by category)
- White background with light gray grid
### Detailed Analysis
**Question Chart Trends:**
1. Peak frequency at ~400 tokens (10² frequency)
2. Gradual decline to 10¹ frequency at 600 tokens
3. Sharp drop to 10⁰ frequency at 800-1000 tokens
4. No data points below 200 tokens
**Answer Chart Trends:**
1. Highest frequency at 10 tokens (10³ frequency)
2. Secondary peak at 100 tokens (10² frequency)
3. Gradual decline through 10¹ to 10³ token ranges
4. Long tail extending to 1000 tokens with low frequencies
### Key Observations
1. **Question Length Distribution**:
- Bimodal pattern with dominant peak at 400 tokens
- 90% of questions contain <600 tokens
- Long questions (>800 tokens) are rare (<10 frequency)
2. **Answer Length Distribution**:
- Exponential decay pattern with log-scaled x-axis
- 50% of answers contain <100 tokens
- Answers between 10-100 tokens dominate (90% of total frequency)
- Very long answers (>100 tokens) show power-law distribution
3. **Scale Differences**:
- Questions use linear x-axis for detailed analysis of mid-range lengths
- Answers use log x-axis to visualize wide range of lengths
- Answer frequencies show 3 orders of magnitude difference between shortest and longest answers
### Interpretation
The data suggests fundamental differences in text generation patterns:
1. **Question Design**:
- Optimal question length clusters around 400 tokens, possibly reflecting human cognitive processing limits
- Technical questions may require longer context (up to 600 tokens)
2. **Answer Structure**:
- Short answers (10 tokens) dominate, indicating prevalence of concise responses
- Power-law distribution suggests few very long answers exist but have disproportionate impact
- Log scale visualization reveals hidden patterns in answer length variability
3. **Practical Implications**:
- Question-answering systems should optimize for 400-token context windows
- Answer generation models need to handle both short responses and rare long-form content
- The 10³ frequency at 10 tokens suggests many answers are single-sentence responses
4. **Anomalies**:
- Question chart shows unexpected drop-off after 400 tokens
- Answer chart's 100-token peak may indicate special formatting requirements
- No data below 200 tokens for questions suggests minimum length requirements