TECHNICAL ASSET FINGERPRINT
94ee865140eda2af73da7fd0
Click to view fullscreen
Press ESC or click to close
FOUND IN PAPERS
EXPERT: healer-alpha-free VERSION 1
RUNTIME: free/openrouter/healer-alpha
INTEL_VERIFIED
## Line Chart: Accuracy Comparison of Four AI Models Across Math Problem Categories
### Overview
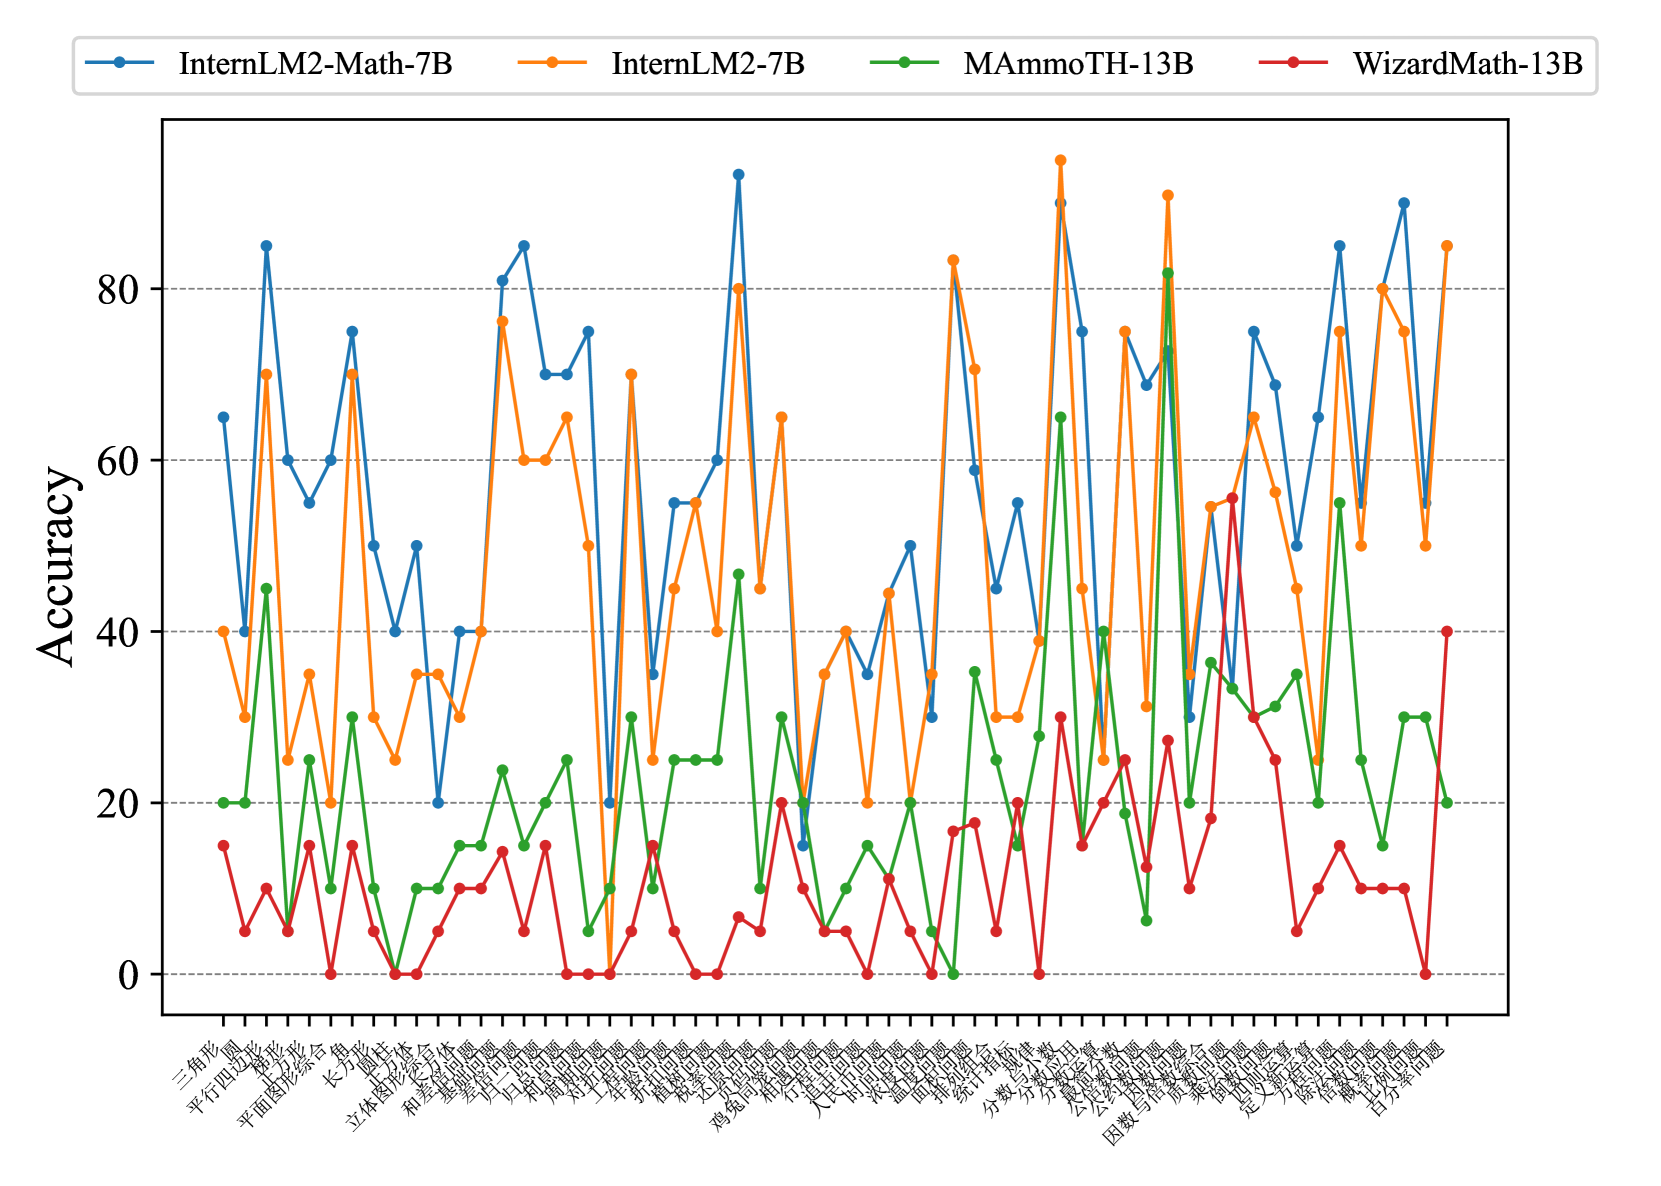
This image is a line chart comparing the performance (accuracy) of four different large language models on a wide variety of math problem categories. The chart displays accuracy percentages on the y-axis against a dense list of specific math topics on the x-axis. The data reveals significant variability in model performance across different types of mathematical problems.
### Components/Axes
* **Chart Type:** Multi-series line chart.
* **Y-Axis:**
* **Label:** "Accuracy"
* **Scale:** Linear, ranging from 0 to approximately 95 (implied by the highest data point).
* **Major Gridlines:** Horizontal dashed lines at 0, 20, 40, 60, and 80.
* **X-Axis:**
* **Label:** Not explicitly labeled, but contains a dense list of math problem categories.
* **Categories (Transcribed from Chinese, left to right):**
1. 三角形 (Triangle)
2. 圆 (Circle)
3. 平行四边形 (Parallelogram)
4. 梯形 (Trapezoid)
5. 长方形 (Rectangle)
6. 平面图形综合 (Plane Figure Synthesis)
7. 角 (Angle)
8. 长方体 (Cuboid)
9. 正方体 (Cube)
10. 立体图形综合 (Solid Figure Synthesis)
11. 和差倍问题 (Sum-Difference-Multiple Problem)
12. 盈亏问题 (Surplus-Deficit Problem)
13. 归一问题 (Unitary Method Problem)
14. 归总问题 (Total Method Problem)
15. 和倍问题 (Sum-Multiple Problem)
16. 差倍问题 (Difference-Multiple Problem)
17. 植树问题 (Tree Planting Problem)
18. 年龄问题 (Age Problem)
19. 鸡兔同笼 (Chicken and Rabbit in the Same Cage)
20. 行程问题 (Travel Problem)
21. 工程问题 (Work Problem)
22. 浓度问题 (Concentration Problem)
23. 经济问题 (Economic Problem)
24. 数列与数表 (Sequence and Number Table)
25. 排列组合 (Permutation and Combination)
26. 统计与概率 (Statistics and Probability)
27. 分数分数应用题 (Fraction Application Problem)
28. 分数百分数 (Fraction Percentage)
29. 公式计算 (Formula Calculation)
30. 公因数与公倍数 (Common Factor and Common Multiple)
31. 因数与倍数 (Factor and Multiple)
32. 质数合数 (Prime and Composite Numbers)
33. 定义新运算 (New Operation Definition)
34. 方程与方程组 (Equation and System of Equations)
35. 除法与减法 (Division and Subtraction)
36. 模糊问题 (Fuzzy Problem)
37. 百分率问题 (Percentage Rate Problem)
* **Legend:** Located at the top center of the chart.
* **Blue line with circle markers:** InternLM2-Math-7B
* **Orange line with circle markers:** InternLM2-7B
* **Green line with circle markers:** MAmmoTH-13B
* **Red line with circle markers:** WizardMath-13B
### Detailed Analysis
**Trend Verification & Data Points (Approximate):**
* **InternLM2-Math-7B (Blue):** Exhibits a highly volatile, "spiky" trend with frequent, sharp peaks and troughs. It achieves the highest overall accuracy on the chart.
* **Notable Peaks:** ~85% (三角形/Triangle), ~85% (和差倍问题/Sum-Difference-Multiple), ~92% (植树问题/Tree Planting), ~88% (排列组合/Permutation and Combination), ~85% (因数与倍数/Factor and Multiple).
* **Notable Troughs:** ~20% (长方体/Cuboid), ~15% (鸡兔同笼/Chicken and Rabbit), ~30% (行程问题/Travel Problem), ~20% (分数百分数/Fraction Percentage).
* **InternLM2-7B (Orange):** Also shows high volatility, often tracking closely with the blue line but generally at a slightly lower accuracy level, with some exceptions.
* **Notable Peaks:** ~95% (植树问题/Tree Planting - highest point on chart), ~83% (经济问题/Economic Problem), ~90% (排列组合/Permutation and Combination), ~85% (百分率问题/Percentage Rate Problem).
* **Notable Troughs:** ~20% (梯形/Trapezoid), ~25% (归一问题/Unitary Method), ~20% (鸡兔同笼/Chicken and Rabbit), ~25% (方程与方程组/Equation).
* **MAmmoTH-13B (Green):** Shows a less volatile but consistently lower performance trend compared to the blue and orange lines. Its accuracy rarely exceeds 60%.
* **Notable Peaks:** ~65% (排列组合/Permutation and Combination), ~55% (因数与倍数/Factor and Multiple), ~45% (圆/Circle).
* **Notable Troughs:** ~0% (长方形/Rectangle, 鸡兔同笼/Chicken and Rabbit, 统计与概率/Statistics and Probability), ~5% (和差倍问题/Sum-Difference-Multiple).
* **WizardMath-13B (Red):** Demonstrates the lowest overall performance, with accuracy frequently at or near 0% for many categories. Its highest points are modest.
* **Notable Peaks:** ~40% (百分率问题/Percentage Rate Problem), ~30% (排列组合/Permutation and Combination), ~25% (公式计算/Formula Calculation).
* **Notable Troughs:** 0% (observed for at least 10 categories including 长方形/Rectangle, 盈亏问题/Surplus-Deficit, 鸡兔同笼/Chicken and Rabbit, 统计与概率/Statistics and Probability).
### Key Observations
1. **Performance Hierarchy:** A clear performance hierarchy is visible: InternLM2-Math-7B (Blue) and InternLM2-7B (Orange) are the top performers, followed by MAmmoTH-13B (Green), with WizardMath-13B (Red) performing the worst.
2. **Problem-Specific Strengths/Weaknesses:** All models show extreme variability. No single model dominates all categories. For example, the "Tree Planting" (植树问题) category sees peak performance for both top models, while "Chicken and Rabbit in the Same Cage" (鸡兔同笼) is a major weakness for all.
3. **Correlation:** The blue and orange lines (both InternLM2 variants) show a strong positive correlation in their peaks and troughs, suggesting similar underlying strengths and weaknesses despite the "Math" fine-tuning of the blue model.
4. **Zero-Performance Categories:** WizardMath-13B (Red) and MAmmoTH-13B (Green) hit 0% accuracy on multiple categories, indicating a complete failure to solve those problem types in this evaluation.
### Interpretation
This chart provides a granular diagnostic of model capabilities across the spectrum of elementary to middle school mathematics. The data suggests that:
* **Specialization Matters:** The "InternLM2-Math-7B" model, presumably fine-tuned for math, does not consistently outperform its base "InternLM2-7B" counterpart. Their performance is intertwined, indicating that general capability may be as important as specialized tuning for this broad set of tasks.
* **The "Long Tail" of Math Problems:** The extreme volatility highlights that AI math proficiency is not monolithic. Models have "blind spots" (e.g., classic puzzles like "Chicken and Rabbit") and areas of relative strength (e.g., combinatorics, percentage problems). This implies that benchmarking on a narrow set of problems can be misleading.
* **Model Robustness:** The consistent underperformance and frequent 0% scores of WizardMath-13B and MAmmoTH-13B suggest they may lack the robustness or foundational reasoning skills required for this diverse problem set compared to the InternLM2 family.
* **Investigative Insight (Peircean):** The chart acts as a **diagnostic index**. The shared troughs (like "Chicken and Rabbit") point to a class of problems that remain a fundamental challenge for current LLMs, possibly due to their reliance on specific logical framing or algebraic translation that models struggle with. The shared peaks suggest problem types that are more amenable to pattern recognition or have been well-represented in training data. The divergence between the two top models on specific categories could be a fruitful area for investigating the effects of math-specific fine-tuning.
DECODING INTELLIGENCE...