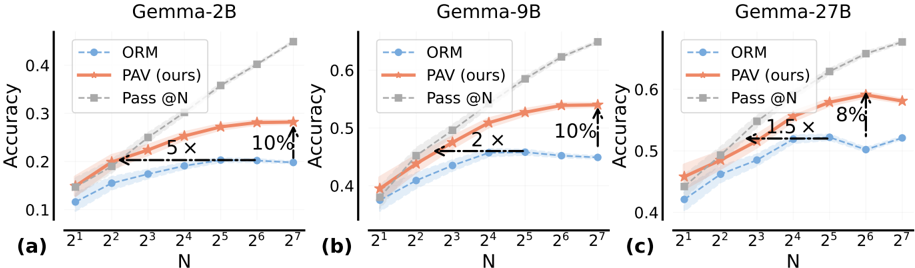
## Line Charts: Gemma Model Accuracy vs. N
### Overview
The image contains three line charts comparing the accuracy of different Gemma models (2B, 9B, and 27B) across varying values of 'N'. Each chart plots the accuracy of three methods: ORM, PAV (ours), and Pass @N, against N, which is displayed on a logarithmic scale. The charts also highlight specific performance differences between the methods at certain N values.
### Components/Axes
* **Titles:**
* Left Chart: Gemma-2B
* Middle Chart: Gemma-9B
* Right Chart: Gemma-27B
* **X-axis:**
* Label: N
* Scale: Logarithmic, with markers at 2<sup>1</sup>, 2<sup>2</sup>, 2<sup>3</sup>, 2<sup>4</sup>, 2<sup>5</sup>, 2<sup>6</sup>, and 2<sup>7</sup>.
* **Y-axis:**
* Label: Accuracy
* Scale: Linear, ranging from 0.1 to 0.4 (Gemma-2B), 0.4 to 0.6 (Gemma-9B), and 0.4 to 0.6 (Gemma-27B).
* **Legend:** (Positioned at the top-left of each chart)
* Blue dashed line with circles: ORM
* Orange solid line with stars: PAV (ours)
* Gray dashed line with squares: Pass @N
* **Annotations:**
* Arrows and text indicating performance differences (e.g., "5x", "10%", "2x", "1.5x", "8%") between methods at specific N values.
* **Chart Labels:**
* (a) - Left Chart
* (b) - Middle Chart
* (c) - Right Chart
### Detailed Analysis
**Gemma-2B (Left Chart)**
* **ORM (Blue):** The accuracy starts around 0.12 at N=2<sup>1</sup>, increases to approximately 0.20 at N=2<sup>3</sup>, and then plateaus around 0.20 for higher N values. There is a shaded region around the line, indicating a confidence interval.
* **PAV (Orange):** The accuracy starts around 0.15 at N=2<sup>1</sup>, increases to approximately 0.25 at N=2<sup>5</sup>, and continues to increase slowly to about 0.28 at N=2<sup>7</sup>. There is a shaded region around the line, indicating a confidence interval.
* **Pass @N (Gray):** The accuracy starts around 0.15 at N=2<sup>1</sup> and increases steadily to approximately 0.42 at N=2<sup>7</sup>.
* **Annotation:** At N=2<sup>3</sup>, PAV is approximately 5 times more accurate than ORM. The accuracy of Pass @N is 10% higher than PAV at N=2<sup>7</sup>.
**Gemma-9B (Middle Chart)**
* **ORM (Blue):** The accuracy starts around 0.38 at N=2<sup>1</sup>, increases to approximately 0.45 at N=2<sup>3</sup>, and then plateaus around 0.45 for higher N values. There is a shaded region around the line, indicating a confidence interval.
* **PAV (Orange):** The accuracy starts around 0.40 at N=2<sup>1</sup>, increases to approximately 0.55 at N=2<sup>5</sup>, and plateaus around 0.58 at N=2<sup>7</sup>. There is a shaded region around the line, indicating a confidence interval.
* **Pass @N (Gray):** The accuracy starts around 0.40 at N=2<sup>1</sup> and increases steadily to approximately 0.68 at N=2<sup>7</sup>.
* **Annotation:** At N=2<sup>3</sup>, PAV is approximately 2 times more accurate than ORM. The accuracy of Pass @N is 10% higher than PAV at N=2<sup>7</sup>.
**Gemma-27B (Right Chart)**
* **ORM (Blue):** The accuracy starts around 0.45 at N=2<sup>1</sup>, increases to approximately 0.52 at N=2<sup>4</sup>, and then decreases slightly to about 0.50 at N=2<sup>7</sup>. There is a shaded region around the line, indicating a confidence interval.
* **PAV (Orange):** The accuracy starts around 0.45 at N=2<sup>1</sup>, increases to approximately 0.55 at N=2<sup>5</sup>, and plateaus around 0.58 at N=2<sup>7</sup>. There is a shaded region around the line, indicating a confidence interval.
* **Pass @N (Gray):** The accuracy starts around 0.45 at N=2<sup>1</sup> and increases steadily to approximately 0.70 at N=2<sup>7</sup>.
* **Annotation:** At N=2<sup>3</sup>, PAV is approximately 1.5 times more accurate than ORM. The accuracy of Pass @N is 8% higher than PAV at N=2<sup>7</sup>.
### Key Observations
* For all three models, Pass @N consistently achieves the highest accuracy across all N values.
* The performance gap between PAV and ORM decreases as the model size increases.
* ORM's accuracy plateaus at lower N values compared to PAV and Pass @N.
* The annotations highlight specific performance gains of PAV over ORM and Pass @N over PAV at certain N values.
### Interpretation
The charts demonstrate the impact of model size (2B, 9B, 27B) and the value of N on the accuracy of different methods (ORM, PAV, Pass @N). The "Pass @N" method consistently outperforms the other two, suggesting it is the most effective approach for these models. The annotations emphasize the relative improvements of PAV over ORM and Pass @N over PAV, providing insights into the specific benefits of each method at different N values. The shaded regions around the lines indicate the uncertainty or variability in the accuracy measurements. The logarithmic scale on the x-axis suggests that the initial increases in N have a more significant impact on accuracy than later increases.