## Line Graphs: Accuracy Comparison Across Model Sizes (Gemma-2B, Gemma-9B, Gemma-27B)
### Overview
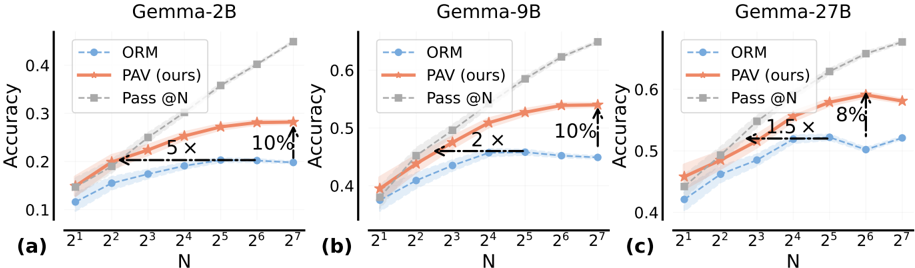
The image contains three line graphs comparing the accuracy of three methods (ORM, PAV, Pass @N) across increasing values of N (2¹ to 2⁷) for three model sizes: Gemma-2B (a), Gemma-9B (b), and Gemma-27B (c). Accuracy is measured on the y-axis (0.1–0.6), while N is logarithmic on the x-axis. Annotations highlight relative performance improvements between methods.
---
### Components/Axes
- **X-axis**: Labeled "N" with values 2¹ to 2⁷ (logarithmic scale).
- **Y-axis**: Labeled "Accuracy" with values 0.1 to 0.6.
- **Legend**:
- **ORM**: Dashed blue line.
- **PAV (ours)**: Solid red line.
- **Pass @N**: Dashed gray line.
- **Annotations**: Arrows with text indicating relative improvements (e.g., "5x", "10%", "1.5x", "8%").
---
### Detailed Analysis
#### Graph (a): Gemma-2B
- **ORM**: Starts at ~0.12 (N=2¹), rises to ~0.2 (N=2⁷). Trend: Gradual upward slope.
- **PAV**: Starts at ~0.15 (N=2¹), rises to ~0.3 (N=2⁷). Trend: Steeper upward slope than ORM.
- **Pass @N**: Starts at ~0.1 (N=2¹), rises to ~0.4 (N=2⁷). Trend: Steepest upward slope.
- **Annotations**:
- Between N=2³ and 2⁴: "5x" (PAV vs. ORM) and "10%" (PAV vs. Pass @N).
#### Graph (b): Gemma-9B
- **ORM**: Starts at ~0.35 (N=2¹), rises to ~0.45 (N=2⁷). Trend: Moderate upward slope.
- **PAV**: Starts at ~0.38 (N=2¹), rises to ~0.55 (N=2⁷). Trend: Steeper than ORM.
- **Pass @N**: Starts at ~0.3 (N=2¹), rises to ~0.6 (N=2⁷). Trend: Steepest upward slope.
- **Annotations**:
- Between N=2³ and 2⁴: "2x" (PAV vs. ORM) and "10%" (PAV vs. Pass @N).
#### Graph (c): Gemma-27B
- **ORM**: Starts at ~0.4 (N=2¹), rises to ~0.5 (N=2⁷). Trend: Gradual upward slope.
- **PAV**: Starts at ~0.42 (N=2¹), rises to ~0.58 (N=2⁷). Trend: Steeper than ORM.
- **Pass @N**: Starts at ~0.4 (N=2¹), rises to ~0.65 (N=2⁷). Trend: Steepest upward slope.
- **Annotations**:
- Between N=2³ and 2⁴: "1.5x" (PAV vs. ORM) and "8%" (PAV vs. Pass @N).
---
### Key Observations
1. **PAV Consistently Outperforms**: Across all model sizes, PAV achieves higher accuracy than ORM and Pass @N, with the gap widening as N increases.
2. **Model Size Impact**: Larger models (Gemma-27B) show higher baseline accuracy and more pronounced performance improvements for PAV.
3. **Pass @N Plateaus**: Pass @N accuracy increases sharply with N but plateaus at higher N values, while PAV and ORM continue improving.
4. **Relative Gains**: Annotations indicate PAV’s accuracy improvements over ORM (e.g., "5x" in Gemma-2B) and Pass @N (e.g., "10%" in Gemma-2B).
---
### Interpretation
- **PAV’s Advantage**: The red line (PAV) demonstrates superior scalability, particularly in larger models (Gemma-27B), suggesting it is more efficient at leveraging model capacity.
- **Pass @N Limitations**: While Pass @N starts strong, its plateau implies diminishing returns at higher N, making it less suitable for large-scale applications.
- **ORM’s Steady Growth**: ORM shows consistent but slower improvement, indicating it may require larger N to match PAV’s performance.
- **Logarithmic N Scale**: The x-axis’s logarithmic scale emphasizes performance gains at lower N values, where PAV’s improvements are most dramatic.
The data suggests PAV is the optimal method for accuracy across model sizes, with larger models amplifying its advantages. The annotations highlight critical inflection points where PAV’s performance diverges significantly from baselines.