## Diagram: Network Topology Comparison
### Overview
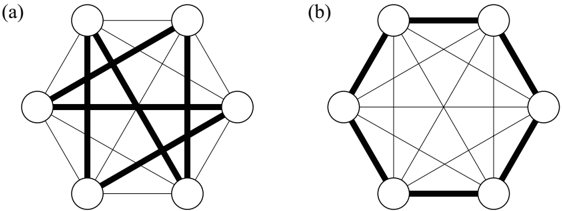
The image contains two diagrams labeled (a) and (b), each depicting a network of interconnected nodes. Both diagrams use circular nodes and straight-line edges, but differ in edge density and connectivity patterns. No textual labels, axis titles, legends, or numerical data are visible in the image.
### Components/Axes
- **Nodes**:
- Both diagrams contain 6 circular nodes arranged in a roughly hexagonal pattern.
- Nodes are unlabeled and uniformly styled (white fill, black outline).
- **Edges**:
- Diagram (a): Dense, overlapping edges with multiple intersections. Some edges are bolded (thicker lines), while others are thin.
- Diagram (b): Sparse, non-overlapping edges forming a star-like pattern within the hexagon. All edges are uniformly thin.
- **No legends, axis markers, or textual annotations are present.**
### Detailed Analysis
- **Diagram (a)**:
- Edges form a complex, crisscrossing pattern with no clear hierarchical structure.
- Bolded edges may indicate primary connections or critical pathways, but this is speculative without labels.
- **Diagram (b)**:
- Edges form a symmetric star pattern connecting non-adjacent nodes, suggesting a focus on long-range or secondary connections.
- The outer hexagon edges are solid, while inner star edges are dashed, possibly indicating different connection types.
### Key Observations
1. **Edge Density**: Diagram (a) has significantly more edges than (b), implying higher connectivity.
2. **Symmetry**: Diagram (b) exhibits radial symmetry, while (a) does not.
3. **Edge Styling**: Bold/thin distinctions in (a) and solid/dashed distinctions in (b) suggest categorical differences in connections, but no legend clarifies this.
### Interpretation
The diagrams likely represent two network topologies:
- **Diagram (a)** could model a densely connected, possibly chaotic or ad-hoc network (e.g., social networks, mesh networks).
- **Diagram (b)** might represent a structured, hierarchical, or optimized network (e.g., transportation systems, distributed computing).
The absence of labels or legends limits definitive interpretation. The bold/dashed edge distinctions and edge density differences suggest intentional design choices, but their meaning remains unclear without additional context.