\n
## Diagram: Network Topology Comparison
### Overview
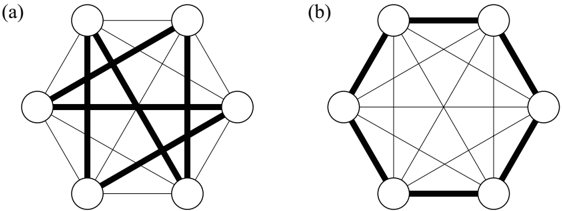
The image presents a comparison of two network topologies, labeled (a) and (b). Both diagrams depict nodes connected by edges, representing a network structure. The diagrams are visually similar but differ in the number of nodes and the pattern of connections. There are no axis labels, legends, or numerical data present.
### Components/Axes
The diagrams consist of:
* **Nodes:** Represented by white circles.
* **Edges:** Represented by black lines connecting the nodes.
* **Labels:** "(a)" and "(b)" identify each network topology.
### Detailed Analysis or Content Details
**Diagram (a):**
* Number of Nodes: 6
* The nodes are arranged approximately in a hexagonal shape.
* Edges: There are approximately 9 edges connecting the nodes. The connections are not fully connected, with several nodes having fewer connections than others. The connections appear somewhat random, lacking a clear pattern.
**Diagram (b):**
* Number of Nodes: 6
* The nodes are arranged in a perfect hexagonal shape.
* Edges: There are approximately 12 edges connecting the nodes. All nodes are connected to every other node, forming a complete graph. The outer perimeter of the hexagon is formed by a continuous set of edges.
### Key Observations
* Diagram (a) represents a sparse network with fewer connections, while diagram (b) represents a dense, fully connected network.
* The arrangement of nodes in diagram (b) is more regular and symmetrical than in diagram (a).
* Both diagrams have the same number of nodes.
### Interpretation
The diagrams likely illustrate the difference between two types of network topologies. Diagram (a) could represent a network with limited redundancy or a network that is still under development. Diagram (b) represents a highly robust network where any node failure does not disrupt connectivity between other nodes. The comparison highlights the trade-offs between cost (number of connections) and reliability (network resilience). The diagrams are abstract representations and do not provide specific information about the nature of the nodes or the purpose of the network. They serve as a visual aid to understand the concept of network topology and its impact on network characteristics.