## Heatmap: Model Prediction Confusion Matrices
### Overview
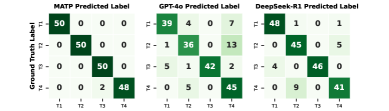
The image presents three confusion matrices, each representing the performance of a different model (MATP, GPT-4o, and DeepSeek-R1) in predicting labels (T1, T2, T3, T4). The matrices visualize the distribution of predicted labels against the ground truth labels. The color intensity represents the number of instances falling into each combination.
### Components/Axes
* **X-axis:** Predicted Label (T1, T2, T3, T4)
* **Y-axis:** Ground Truth Label (T1, T2, T3, T4)
* **Matrices:** Three separate confusion matrices, one for each model:
* MATP Predicted Label
* GPT-4o Predicted Label
* DeepSeek-R1 Predicted Label
* **Color Scale:** The color intensity represents the count of instances. Darker green indicates higher counts, while lighter green indicates lower counts.
* **Correlation Coefficient (ρ):** Displayed for each matrix, indicating the correlation between predicted and ground truth labels.
### Detailed Analysis
**MATP Predicted Label**
* **Trend:** The matrix shows strong diagonal dominance, indicating good performance.
* **Data Points:**
* T1 predicted as T1: 50
* T1 predicted as T2: 0
* T1 predicted as T3: 0
* T1 predicted as T4: 0
* T2 predicted as T1: 0
* T2 predicted as T2: 50
* T2 predicted as T3: 0
* T2 predicted as T4: 0
* T3 predicted as T1: 0
* T3 predicted as T2: 0
* T3 predicted as T3: 50
* T3 predicted as T4: 0
* T4 predicted as T1: 0
* T4 predicted as T2: 2
* T4 predicted as T3: 48
* T4 predicted as T4: 0
* **ρ:** Approximately 1.0
**GPT-4o Predicted Label**
* **Trend:** Also shows diagonal dominance, but with some off-diagonal values.
* **Data Points:**
* T1 predicted as T1: 39
* T1 predicted as T2: 4
* T1 predicted as T3: 0
* T1 predicted as T4: 7
* T2 predicted as T1: 1
* T2 predicted as T2: 36
* T2 predicted as T3: 0
* T2 predicted as T4: 13
* T3 predicted as T1: 5
* T3 predicted as T2: 1
* T3 predicted as T3: 42
* T3 predicted as T4: 2
* T4 predicted as T1: 0
* T4 predicted as T2: 5
* T4 predicted as T3: 0
* T4 predicted as T4: 45
* **ρ:** Approximately 0.9
**DeepSeek-R1 Predicted Label**
* **Trend:** Similar to GPT-4o, with diagonal dominance and some off-diagonal values.
* **Data Points:**
* T1 predicted as T1: 48
* T1 predicted as T2: 1
* T1 predicted as T3: 0
* T1 predicted as T4: 1
* T2 predicted as T1: 0
* T2 predicted as T2: 45
* T2 predicted as T3: 0
* T2 predicted as T4: 5
* T3 predicted as T1: 4
* T3 predicted as T2: 0
* T3 predicted as T3: 46
* T3 predicted as T4: 0
* T4 predicted as T1: 0
* T4 predicted as T2: 9
* T4 predicted as T3: 0
* T4 predicted as T4: 41
* **ρ:** Approximately 0.9
### Key Observations
* All three models demonstrate relatively high accuracy, as indicated by the strong diagonal dominance in their confusion matrices.
* MATP has the highest correlation coefficient (ρ ≈ 1.0), suggesting the strongest agreement between predicted and ground truth labels.
* GPT-4o and DeepSeek-R1 have slightly lower correlation coefficients (ρ ≈ 0.9), indicating some misclassifications.
* The most common misclassifications for GPT-4o and DeepSeek-R1 involve confusing T1 with T2 and T4 with T3.
* MATP has very few misclassifications, with the only notable one being T4 sometimes predicted as T3.
### Interpretation
The confusion matrices provide a comparative assessment of the three models' performance in a four-class classification task. The data suggests that MATP is the most accurate model, closely followed by GPT-4o and DeepSeek-R1. The correlation coefficients quantify the strength of the relationship between the models' predictions and the actual labels.
The off-diagonal values in the matrices reveal the types of errors each model makes. For example, the tendency of GPT-4o and DeepSeek-R1 to confuse T1 with T2 suggests that these labels may have some overlapping features or that the models struggle to distinguish between them.
The consistent diagonal dominance across all three matrices indicates that the classification task is relatively well-defined and that the models are generally able to learn the underlying patterns in the data. The slight differences in performance highlight the trade-offs between different model architectures and training strategies. The values in the matrices are counts, and the sum of each row represents the total number of instances of a particular ground truth label. The sum of each column represents the total number of times a particular label was predicted.