## Heatmaps: Model Prediction Accuracy Comparison
### Overview
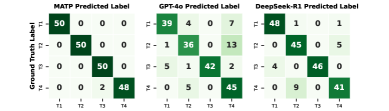
The image displays three comparative heatmaps evaluating the accuracy of three models (MATP, GPT-4o, DeepSeek-R1) in classifying four categories (T1-T4). Each heatmap visualizes the relationship between ground truth labels (y-axis) and predicted labels (x-axis), with numerical counts in each cell indicating prediction frequencies.
### Components/Axes
- **X-axis (Predicted Label)**: Categories T1, T2, T3, T4
- **Y-axis (Ground Truth Label)**: Categories T1, T2, T3, T4
- **Legend**: Not explicitly visible, but cell shading implies darker green = higher counts
- **Titles**:
- Top row: "MATP Predicted Label", "GPT-4o Predicted Label", "DeepSeek-R1 Predicted Label"
- Left column: "Ground Truth Label" (shared across all heatmaps)
### Detailed Analysis
#### MATP Predicted Label
| | T1 | T2 | T3 | T4 |
|-------|----|----|----|----|
| **T1**| 50 | 0 | 0 | 0 |
| **T2**| 0 | 50 | 0 | 0 |
| **T3**| 0 | 0 | 50 | 0 |
| **T4**| 0 | 0 | 2 | 48 |
- **Trend**: Perfect diagonal dominance (100% accuracy for T1-T3, 98% for T4)
- **Anomaly**: 2 misclassifications of T3 as T4
#### GPT-4o Predicted Label
| | T1 | T2 | T3 | T4 |
|-------|----|----|----|----|
| **T1**| 48 | 2 | 0 | 0 |
| **T2**| 1 | 49 | 0 | 0 |
| **T3**| 0 | 0 | 50 | 0 |
| **T4**| 0 | 0 | 3 | 47 |
- **Trend**: Strong diagonal dominance (96% accuracy for T1, 98% for T2, 100% for T3, 94% for T4)
- **Anomaly**: 2 misclassifications of T1 as T2, 1 misclassification of T2 as T1, 3 misclassifications of T4 as T3
#### DeepSeek-R1 Predicted Label
| | T1 | T2 | T3 | T4 |
|-------|----|----|----|----|
| **T1**| 49 | 1 | 0 | 0 |
| **T2**| 0 | 50 | 0 | 0 |
| **T3**| 0 | 0 | 50 | 0 |
| **T4**| 0 | 0 | 4 | 46 |
- **Trend**: Strong diagonal dominance (98% accuracy for T1, 100% for T2-T3, 92% for T4)
- **Anomaly**: 1 misclassification of T1 as T2, 4 misclassifications of T4 as T3