## Bar Chart: Overall Accuracy Comparison
### Overview
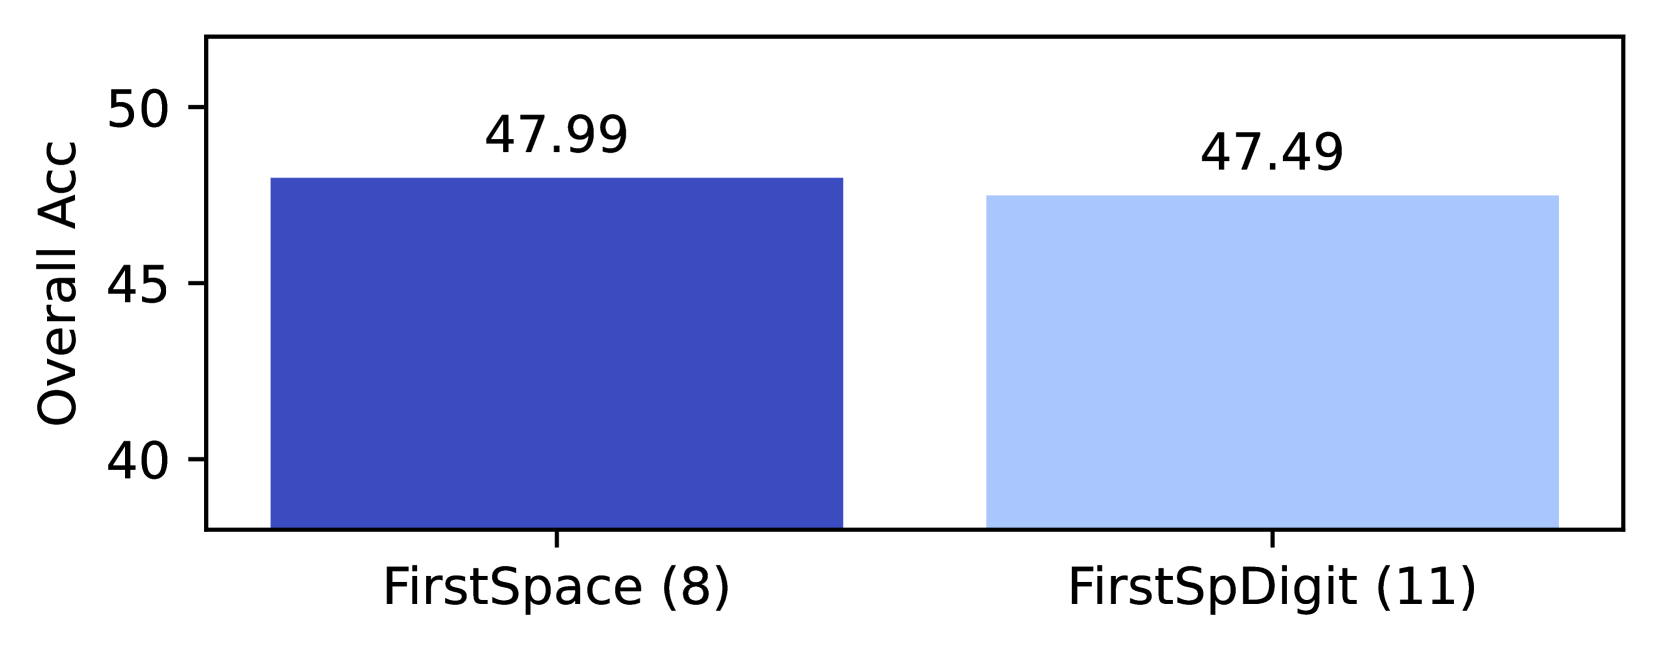
The image is a bar chart comparing the overall accuracy of two categories: "FirstSpace (8)" and "FirstSpDigit (11)". The y-axis represents "Overall Acc" (presumably accuracy), ranging from 40 to 50. The chart shows that "FirstSpace (8)" has a slightly higher accuracy than "FirstSpDigit (11)".
### Components/Axes
* **X-axis:** Categorical axis with two categories: "FirstSpace (8)" and "FirstSpDigit (11)".
* **Y-axis:** Numerical axis labeled "Overall Acc", ranging from 40 to 50, with tick marks at 40, 45, and 50.
* **Bars:** Two bars representing the accuracy for each category. The "FirstSpace (8)" bar is dark blue, and the "FirstSpDigit (11)" bar is light blue.
* **Values:** Numerical values are displayed above each bar, indicating the exact accuracy.
### Detailed Analysis
* **FirstSpace (8):** The dark blue bar representing "FirstSpace (8)" reaches an accuracy of 47.99.
* **FirstSpDigit (11):** The light blue bar representing "FirstSpDigit (11)" reaches an accuracy of 47.49.
### Key Observations
* "FirstSpace (8)" has a slightly higher overall accuracy (47.99) compared to "FirstSpDigit (11)" (47.49).
* The difference in accuracy between the two categories is approximately 0.5 percentage points.
### Interpretation
The bar chart suggests that the "FirstSpace (8)" category performs marginally better in terms of overall accuracy compared to the "FirstSpDigit (11)" category. The difference is small, indicating that both categories have relatively similar performance. The numbers in parentheses, (8) and (11), might refer to the number of samples or some other relevant parameter for each category. Further context would be needed to fully understand the significance of these numbers.