\n
## Bar Chart: Overall Accuracy Comparison
### Overview
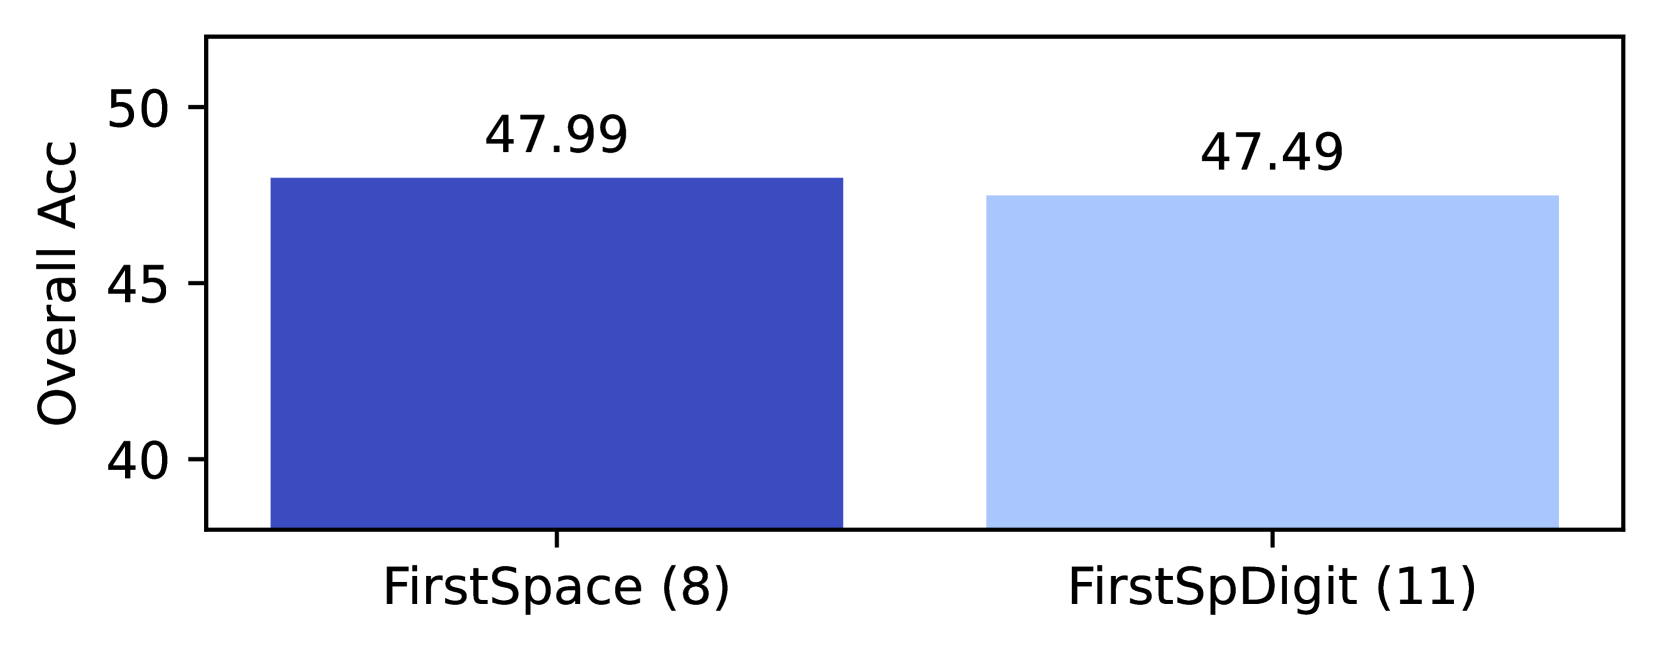
This image presents a bar chart comparing the "Overall ACC" (Accuracy) of two models: "FirstSpace (8)" and "FirstSpDigit (11)". The chart uses vertical bars to represent the accuracy scores for each model.
### Components/Axes
* **X-axis:** Represents the models being compared. The categories are "FirstSpace (8)" and "FirstSpDigit (11)". The numbers in parentheses likely indicate the number of parameters or some other model characteristic.
* **Y-axis:** Labeled "Overall ACC", representing the overall accuracy score. The scale ranges from approximately 38 to 50.
* **Bars:** Two vertical bars, one for each model. The bar for "FirstSpace (8)" is filled with a dark blue color, and the bar for "FirstSpDigit (11)" is filled with a light blue color.
* **Data Labels:** Each bar has a numerical label indicating the accuracy score.
### Detailed Analysis
* **FirstSpace (8):** The dark blue bar reaches a height corresponding to approximately 47.99 on the "Overall ACC" scale.
* **FirstSpDigit (11):** The light blue bar reaches a height corresponding to approximately 47.49 on the "Overall ACC" scale.
* The "FirstSpace (8)" model has a slightly higher accuracy score than the "FirstSpDigit (11)" model.
### Key Observations
* The accuracy scores for both models are very close, with a difference of only 0.5%.
* Both models achieve an accuracy score around 47-48%.
### Interpretation
The data suggests that both "FirstSpace (8)" and "FirstSpDigit (11)" models perform similarly in terms of overall accuracy. The "FirstSpace (8)" model exhibits a marginally better performance, but the difference is minimal. The numbers in parentheses, (8) and (11), likely represent the model size or complexity. It's possible that increasing model complexity (from 8 to 11 parameters) does not significantly improve accuracy in this case, or that the benefit is outweighed by other factors like computational cost. Further investigation would be needed to understand the trade-offs between model size and performance. The chart provides a direct comparison of the two models' accuracy, allowing for a quick assessment of their relative strengths.