## Line Chart: On-Policy GRPO using πk
### Overview
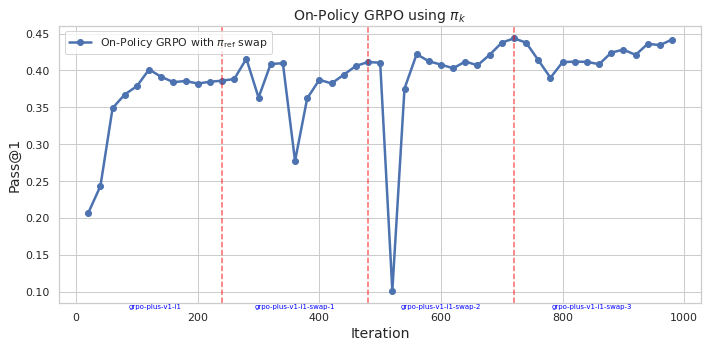
The image is a line chart that displays the performance of "On-Policy GRPO with πref swap" over iterations. The y-axis represents "Pass@1", a performance metric, and the x-axis represents "Iteration". The chart includes vertical dashed lines indicating specific swap events.
### Components/Axes
* **Title:** On-Policy GRPO using πk
* **X-axis:**
* Label: Iteration
* Scale: 0 to 1000, with markers at 0, 200, 400, 600, 800, and 1000.
* **Y-axis:**
* Label: Pass@1
* Scale: 0.10 to 0.45, with markers at 0.10, 0.15, 0.20, 0.25, 0.30, 0.35, 0.40, and 0.45.
* **Legend:** Located in the top-left corner.
* Blue Line: On-Policy GRPO with πref swap
* **Vertical Dashed Lines:** Three vertical dashed lines, colored light red, are present at approximately x=250, x=550, and x=750.
* The first line at x=250 is labeled "grpo-plus-v1-l1".
* The second line at x=550 is labeled "grpo-plus-v1-l1-swap-1".
* The third line at x=750 is labeled "grpo-plus-v1-l1-swap-2".
### Detailed Analysis
* **On-Policy GRPO with πref swap (Blue Line):**
* Trend: Initially, the line slopes upward from approximately (0, 0.21) to (100, 0.37). It then plateaus around 0.38-0.40 until the first vertical line. After the first vertical line, the line drops to approximately 0.28, then rises again to approximately 0.39 before dropping sharply to approximately 0.10 at the second vertical line. After the second vertical line, the line rises sharply to approximately 0.38, then plateaus around 0.41-0.44 until the third vertical line. After the third vertical line, the line drops to approximately 0.39, then rises again to approximately 0.44.
* Data Points:
* (0, 0.21)
* (100, 0.37)
* (200, 0.39)
* (300, 0.36)
* (400, 0.28)
* (500, 0.38)
* (550, 0.10)
* (600, 0.38)
* (700, 0.41)
* (800, 0.39)
* (900, 0.41)
* (1000, 0.44)
### Key Observations
* The "On-Policy GRPO with πref swap" performance, as measured by "Pass@1", generally increases over iterations, but experiences significant drops at or near the "swap" events indicated by the vertical dashed lines.
* The performance recovers after each swap event, suggesting the algorithm adapts.
### Interpretation
The chart illustrates the impact of "πref swap" events on the performance of the "On-Policy GRPO" algorithm. The drops in "Pass@1" at each swap indicate a temporary disruption in performance, possibly due to the change in the reference policy. However, the subsequent recovery suggests that the algorithm is able to adapt and continue learning, eventually reaching a higher performance level. The swap events are likely part of an exploration strategy, where the algorithm is forced to explore new regions of the policy space.