## Line Chart: On-Policy GRPO using π_k
### Overview
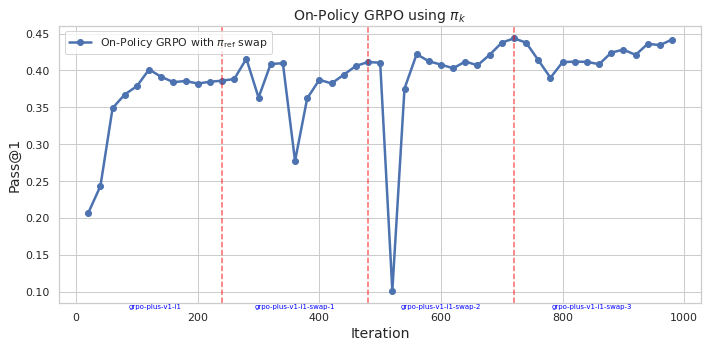
The image displays a line chart tracking the performance of a reinforcement learning algorithm, specifically "On-Policy GRPO with π_ref swap," over 1000 training iterations. The chart plots the "Pass@1" metric against the iteration number, showing significant volatility with an overall upward trend. Four vertical dashed lines mark specific iteration points, each annotated with a label below the x-axis.
### Components/Axes
* **Chart Title:** "On-Policy GRPO using π_k" (centered at the top).
* **Y-Axis:**
* **Label:** "Pass@1" (rotated vertically on the left).
* **Scale:** Linear, ranging from 0.10 to 0.45. Major tick marks are at 0.10, 0.15, 0.20, 0.25, 0.30, 0.35, 0.40, and 0.45.
* **X-Axis:**
* **Label:** "Iteration" (centered at the bottom).
* **Scale:** Linear, ranging from 0 to 1000. Major tick marks are at 0, 200, 400, 600, 800, and 1000.
* **Legend:**
* **Position:** Top-left corner of the plot area.
* **Content:** A blue line with a circle marker labeled "On-Policy GRPO with π_ref swap".
* **Data Series:** A single blue line with circular markers at each data point.
* **Annotations:** Four vertical, red, dashed lines extending from the x-axis to the top of the plot. Each is labeled with blue text below the x-axis:
1. At approximately Iteration 250: `grpo-plus-v1-11`
2. At approximately Iteration 350: `grpo-plus-v1-11-swap-1`
3. At approximately Iteration 500: `grpo-plus-v1-11-swap-2`
4. At approximately Iteration 700: `grpo-plus-v1-11-swap-3`
### Detailed Analysis
**Trend Verification:** The blue line shows a general upward trend from the start to the end of the plotted iterations, but with high volatility. It rises sharply initially, enters a period of fluctuation, experiences a dramatic drop, recovers, and then continues a more gradual, fluctuating ascent.
**Approximate Data Points (Pass@1 vs. Iteration):**
* **Start (Iteration ~0):** ~0.21
* **Initial Rise:** Rapid increase to ~0.35 by Iteration ~50.
* **First Plateau/Fluctuation:** Hovers between ~0.38 and ~0.40 from Iteration ~100 to ~250.
* **First Annotation (`grpo-plus-v1-11` at ~250):** Value is ~0.38.
* **Post-250 Fluctuation:** Dips to ~0.36, recovers to ~0.41, then drops sharply to ~0.28 around Iteration ~380.
* **Second Annotation (`grpo-plus-v1-11-swap-1` at ~350):** Value is on a downward slope, approximately ~0.36.
* **Recovery and Second Peak:** Recovers to ~0.41 by Iteration ~450.
* **Third Annotation (`grpo-plus-v1-11-swap-2` at ~500):** This coincides with the most dramatic feature—a precipitous drop to the chart's minimum value of ~0.10.
* **Post-500 Recovery:** Extremely sharp recovery back to ~0.42 by Iteration ~550.
* **Fourth Annotation (`grpo-plus-v1-11-swap-3` at ~700):** Value is near the chart's maximum, approximately ~0.44.
* **Final Segment:** After a dip to ~0.39 around Iteration ~750, the line trends upward with fluctuations, ending at approximately ~0.44 at Iteration ~1000.
### Key Observations
1. **Extreme Volatility at Swap-2:** The most notable event is the catastrophic drop in performance (Pass@1 from ~0.41 to ~0.10) at the iteration marked `grpo-plus-v1-11-swap-2` (~500). This is immediately followed by an equally sharp recovery.
2. **Correlation with Annotations:** Performance dips are observed around or shortly after each annotated "swap" event (especially at ~380 and ~500), suggesting these events (likely policy or reference model swaps) introduce instability.
3. **Overall Positive Trend:** Despite the severe mid-training collapse, the algorithm demonstrates resilience, recovering and ultimately achieving a higher Pass@1 score (~0.44) at the end of the run than at any prior point.
4. **Performance Range:** The Pass@1 metric varies widely, from a low of ~0.10 to a high of ~0.44, indicating high sensitivity to the training process or the specific swap events.
### Interpretation
This chart visualizes the training dynamics of an on-policy reinforcement learning algorithm (GRPO) that involves periodic swaps of a reference policy (π_ref). The "Pass@1" metric likely measures task success rate.
The data suggests that the **policy swap events are critical points of instability**. The swap at iteration 500 (`swap-2`) caused a near-total collapse in performance, which could indicate a severe mismatch between the new reference policy and the current agent policy, or a disruptive change in the optimization landscape. However, the system's ability to rapidly recover from this collapse and continue improving is a sign of robustness.
The **upward trend** implies that, despite these disruptive events, the learning process is effective over the long term. The final performance is the highest observed, suggesting the swaps, while destabilizing in the short term, may ultimately be beneficial for escaping local optima or adapting the policy. The pattern of "dip and recover" after each swap (most dramatically after `swap-2`) is a key characteristic of this training run. An investigator would want to examine the algorithmic details of the "swap" operation and the conditions at iteration 500 to understand the cause of the extreme drop.