## Line Graph: On-Policy GRPO using π_k
### Overview
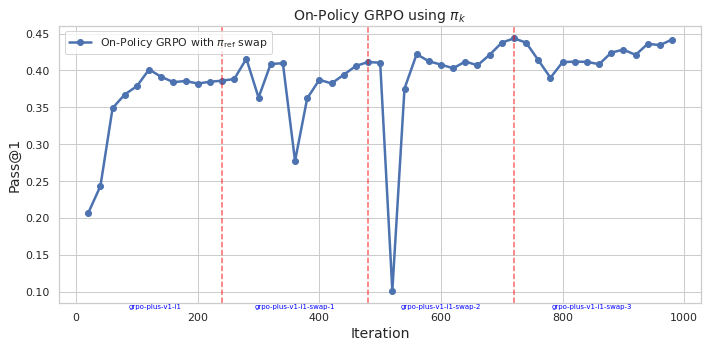
The image depicts a line graph tracking the performance of an "On-Policy GRPO with π_ref swap" algorithm over 1000 iterations. The y-axis measures "Pass@1" (a metric likely representing task success rate), while the x-axis represents training iterations. The graph includes a blue data line and four red dashed vertical markers at specific iteration points.
### Components/Axes
- **Title**: "On-Policy GRPO using π_k"
- **X-axis**: "iteration" (0 to 1000, linear scale)
- **Y-axis**: "Pass@1" (0.10 to 0.45, linear scale)
- **Legend**: Located in the top-right corner, labeled "On-Policy GRPO with π_ref swap" (blue line)
- **Red Dashed Lines**: Four vertical markers at iterations 200, 400, 600, and 800, labeled:
- "gpo-plus-v1-11-swap-1" (200)
- "gpo-plus-v1-11-swap-2" (400)
- "gpo-plus-v1-11-swap-3" (600)
- "gpo-plus-v1-11-swap-4" (800)
### Detailed Analysis
- **Blue Line (On-Policy GRPO with π_ref swap)**:
- Starts at ~0.20 at iteration 0.
- Rises sharply to ~0.40 by iteration 100.
- Peaks at ~0.45 near iteration 200 (coinciding with "gpo-plus-v1-11-swap-1").
- Drops abruptly to ~0.10 at iteration 400 ("gpo-plus-v1-11-swap-2").
- Recovers to ~0.40 by iteration 600, then fluctuates between ~0.38–0.44 until iteration 1000.
- Notable instability at iteration 400 (sharp dip) and minor dips at 600 and 800.
### Key Observations
1. **Initial Growth**: Rapid improvement in performance during early iterations (0–200).
2. **Catastrophic Drop**: A 70% performance drop at iteration 400 ("gpo-plus-v1-11-swap-2"), suggesting a critical failure or parameter adjustment.
3. **Recovery and Stability**: Partial recovery after iteration 400, with sustained performance (~0.38–0.44) in later iterations.
4. **Red Markers**: Align with labeled "swap" events, indicating potential hyperparameter changes or training phases.
### Interpretation
The graph demonstrates the GRPO algorithm's sensitivity to parameter swaps (π_ref). The catastrophic drop at iteration 400 ("gpo-plus-v1-11-swap-2") suggests that the swap introduced instability, possibly due to overfitting or misalignment with the policy. The recovery phase implies adaptive adjustments, but the persistent fluctuations highlight challenges in maintaining stability during training. The red markers likely denote experimental interventions, with the 400-iteration swap being the most disruptive. This pattern underscores the importance of careful hyperparameter tuning in reinforcement learning algorithms.