## Line Chart: Accuracy vs. Attack Ratio for Different Federated Learning Methods
### Overview
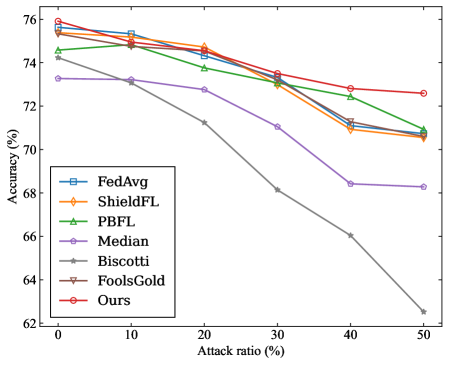
The image is a line chart comparing the accuracy of different federated learning methods as the attack ratio increases. The x-axis represents the attack ratio (percentage), and the y-axis represents the accuracy (percentage). Seven different federated learning methods are compared: FedAvg, ShieldFL, PBFL, Median, Biscotti, FoolsGold, and Ours.
### Components/Axes
* **X-axis:** Attack ratio (%), with markers at 0, 10, 20, 30, 40, and 50.
* **Y-axis:** Accuracy (%), with markers at 62, 64, 66, 68, 70, 72, 74, and 76.
* **Legend:** Located on the left side of the chart, listing the seven federated learning methods with corresponding colors and markers.
* FedAvg (blue, square marker)
* ShieldFL (orange, diamond marker)
* PBFL (green, triangle marker)
* Median (purple, circle marker)
* Biscotti (gray, star marker)
* FoolsGold (brown, inverted triangle marker)
* Ours (red, circle marker)
### Detailed Analysis
* **FedAvg (blue, square marker):** Starts at approximately 75% accuracy at 0% attack ratio and decreases to approximately 71% accuracy at 50% attack ratio.
* (0, 75)
* (10, 75)
* (20, 74.5)
* (30, 73.5)
* (40, 71.5)
* (50, 71)
* **ShieldFL (orange, diamond marker):** Starts at approximately 75.5% accuracy at 0% attack ratio and decreases to approximately 70.5% accuracy at 50% attack ratio.
* (0, 75.5)
* (10, 75)
* (20, 74.5)
* (30, 73.5)
* (40, 71)
* (50, 70.5)
* **PBFL (green, triangle marker):** Starts at approximately 74.5% accuracy at 0% attack ratio and decreases to approximately 71% accuracy at 50% attack ratio.
* (0, 74.5)
* (10, 75)
* (20, 74)
* (30, 73.5)
* (40, 71.5)
* (50, 71)
* **Median (purple, circle marker):** Starts at approximately 73.5% accuracy at 0% attack ratio and decreases to approximately 68.5% accuracy at 50% attack ratio.
* (0, 73.5)
* (10, 73.5)
* (20, 73)
* (30, 71.5)
* (40, 68.5)
* (50, 68.5)
* **Biscotti (gray, star marker):** Starts at approximately 75% accuracy at 0% attack ratio and decreases significantly to approximately 62.5% accuracy at 50% attack ratio.
* (0, 75)
* (10, 74.5)
* (20, 71.5)
* (30, 68)
* (40, 66)
* (50, 62.5)
* **FoolsGold (brown, inverted triangle marker):** Starts at approximately 75.5% accuracy at 0% attack ratio and decreases to approximately 70.5% accuracy at 50% attack ratio.
* (0, 75.5)
* (10, 75)
* (20, 74.5)
* (30, 73.5)
* (40, 71.5)
* (50, 70.5)
* **Ours (red, circle marker):** Starts at approximately 76% accuracy at 0% attack ratio and decreases to approximately 72.5% accuracy at 50% attack ratio.
* (0, 76)
* (10, 75.5)
* (20, 74.5)
* (30, 73.5)
* (40, 71.5)
* (50, 72.5)
### Key Observations
* All methods show a decrease in accuracy as the attack ratio increases.
* Biscotti shows the most significant drop in accuracy as the attack ratio increases.
* The "Ours" method consistently maintains the highest accuracy across all attack ratios, except at 0% where it is tied with FoolsGold.
* FedAvg, ShieldFL, PBFL, and FoolsGold perform similarly.
* Median performs worse than FedAvg, ShieldFL, PBFL, FoolsGold, and "Ours" but better than Biscotti.
### Interpretation
The chart demonstrates the impact of increasing attack ratios on the accuracy of different federated learning methods. The "Ours" method appears to be the most robust against attacks, maintaining the highest accuracy as the attack ratio increases. Biscotti is the most vulnerable to attacks, experiencing the largest drop in accuracy. The other methods (FedAvg, ShieldFL, PBFL, and FoolsGold) show similar performance, while Median falls in the middle. This suggests that the "Ours" method may incorporate some form of attack mitigation or resilience that is not present in the other methods, or is more effective. The data highlights the importance of considering attack resilience when selecting a federated learning method, especially in environments where attacks are likely.