## Line Graph: Accuracy vs. Attack Ratio
### Overview
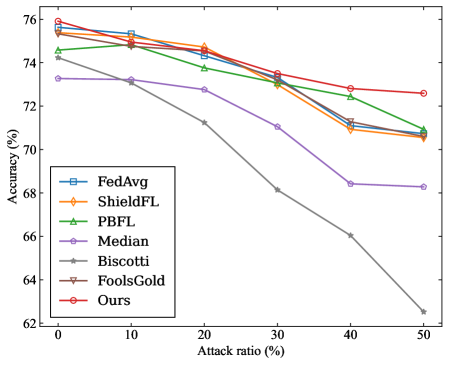
The graph illustrates the relationship between accuracy (%) and attack ratio (%) for eight different methods. All methods show a general decline in accuracy as the attack ratio increases, with varying degrees of resilience. The legend identifies the methods by color and marker, positioned on the left side of the graph.
### Components/Axes
- **Y-axis**: Accuracy (%) ranging from 62% to 76%.
- **X-axis**: Attack ratio (%) ranging from 0% to 50%.
- **Legend**: Located on the left, with the following mappings:
- **FedAvg**: Blue squares (□)
- **ShieldFL**: Orange diamonds (◇)
- **PBFL**: Green triangles (△)
- **Median**: Purple pentagons (⬡)
- **Biscotti**: Gray stars (★)
- **FoolsGold**: Brown triangles (▼)
- **Ours**: Red circles (●)
### Detailed Analysis
1. **FedAvg (Blue □)**: Starts at ~75.5% accuracy at 0% attack ratio, declining to ~70.5% at 50%.
2. **ShieldFL (Orange ◇)**: Begins at ~75% accuracy, dropping to ~70% at 50%.
3. **PBFL (Green △)**: Starts at ~74.5%, ending at ~70.5%.
4. **Median (Purple ⬡)**: Declines from ~73% to ~68%.
5. **Biscotti (Gray ★)**: Steepest drop from ~74% to ~62.5%.
6. **FoolsGold (Brown ▼)**: Starts at ~75%, ending at ~70%.
7. **Ours (Red ●)**: Declines from ~75.5% to ~72.5%.
### Key Observations
- **Biscotti (Gray ★)** exhibits the most significant decline, losing ~11.5% accuracy over 50% attack ratio.
- **Ours (Red ●)** and **FedAvg (Blue □)** maintain higher accuracy than most methods, with **Ours** showing the smallest drop (~3%).
- **ShieldFL (Orange ◇)** and **FoolsGold (Brown ▼)** have similar trends but **ShieldFL** starts slightly higher.
- **Median (Purple ⬡)** shows a moderate decline (~5%) compared to others.
### Interpretation
The data suggests that **Biscotti** is the least resilient method under increasing attack ratios, while **Ours** and **FedAvg** demonstrate superior robustness. The steep decline in **Biscotti** indicates potential vulnerabilities in its design or implementation. **Ours** and **FedAvg** outperform other methods at higher attack ratios, though **FedAvg** starts with marginally higher initial accuracy. The graph highlights trade-offs between initial performance and resilience, with **Ours** balancing both effectively. The consistent downward trends across all methods underscore the inherent challenge of maintaining accuracy under adversarial conditions.