\n
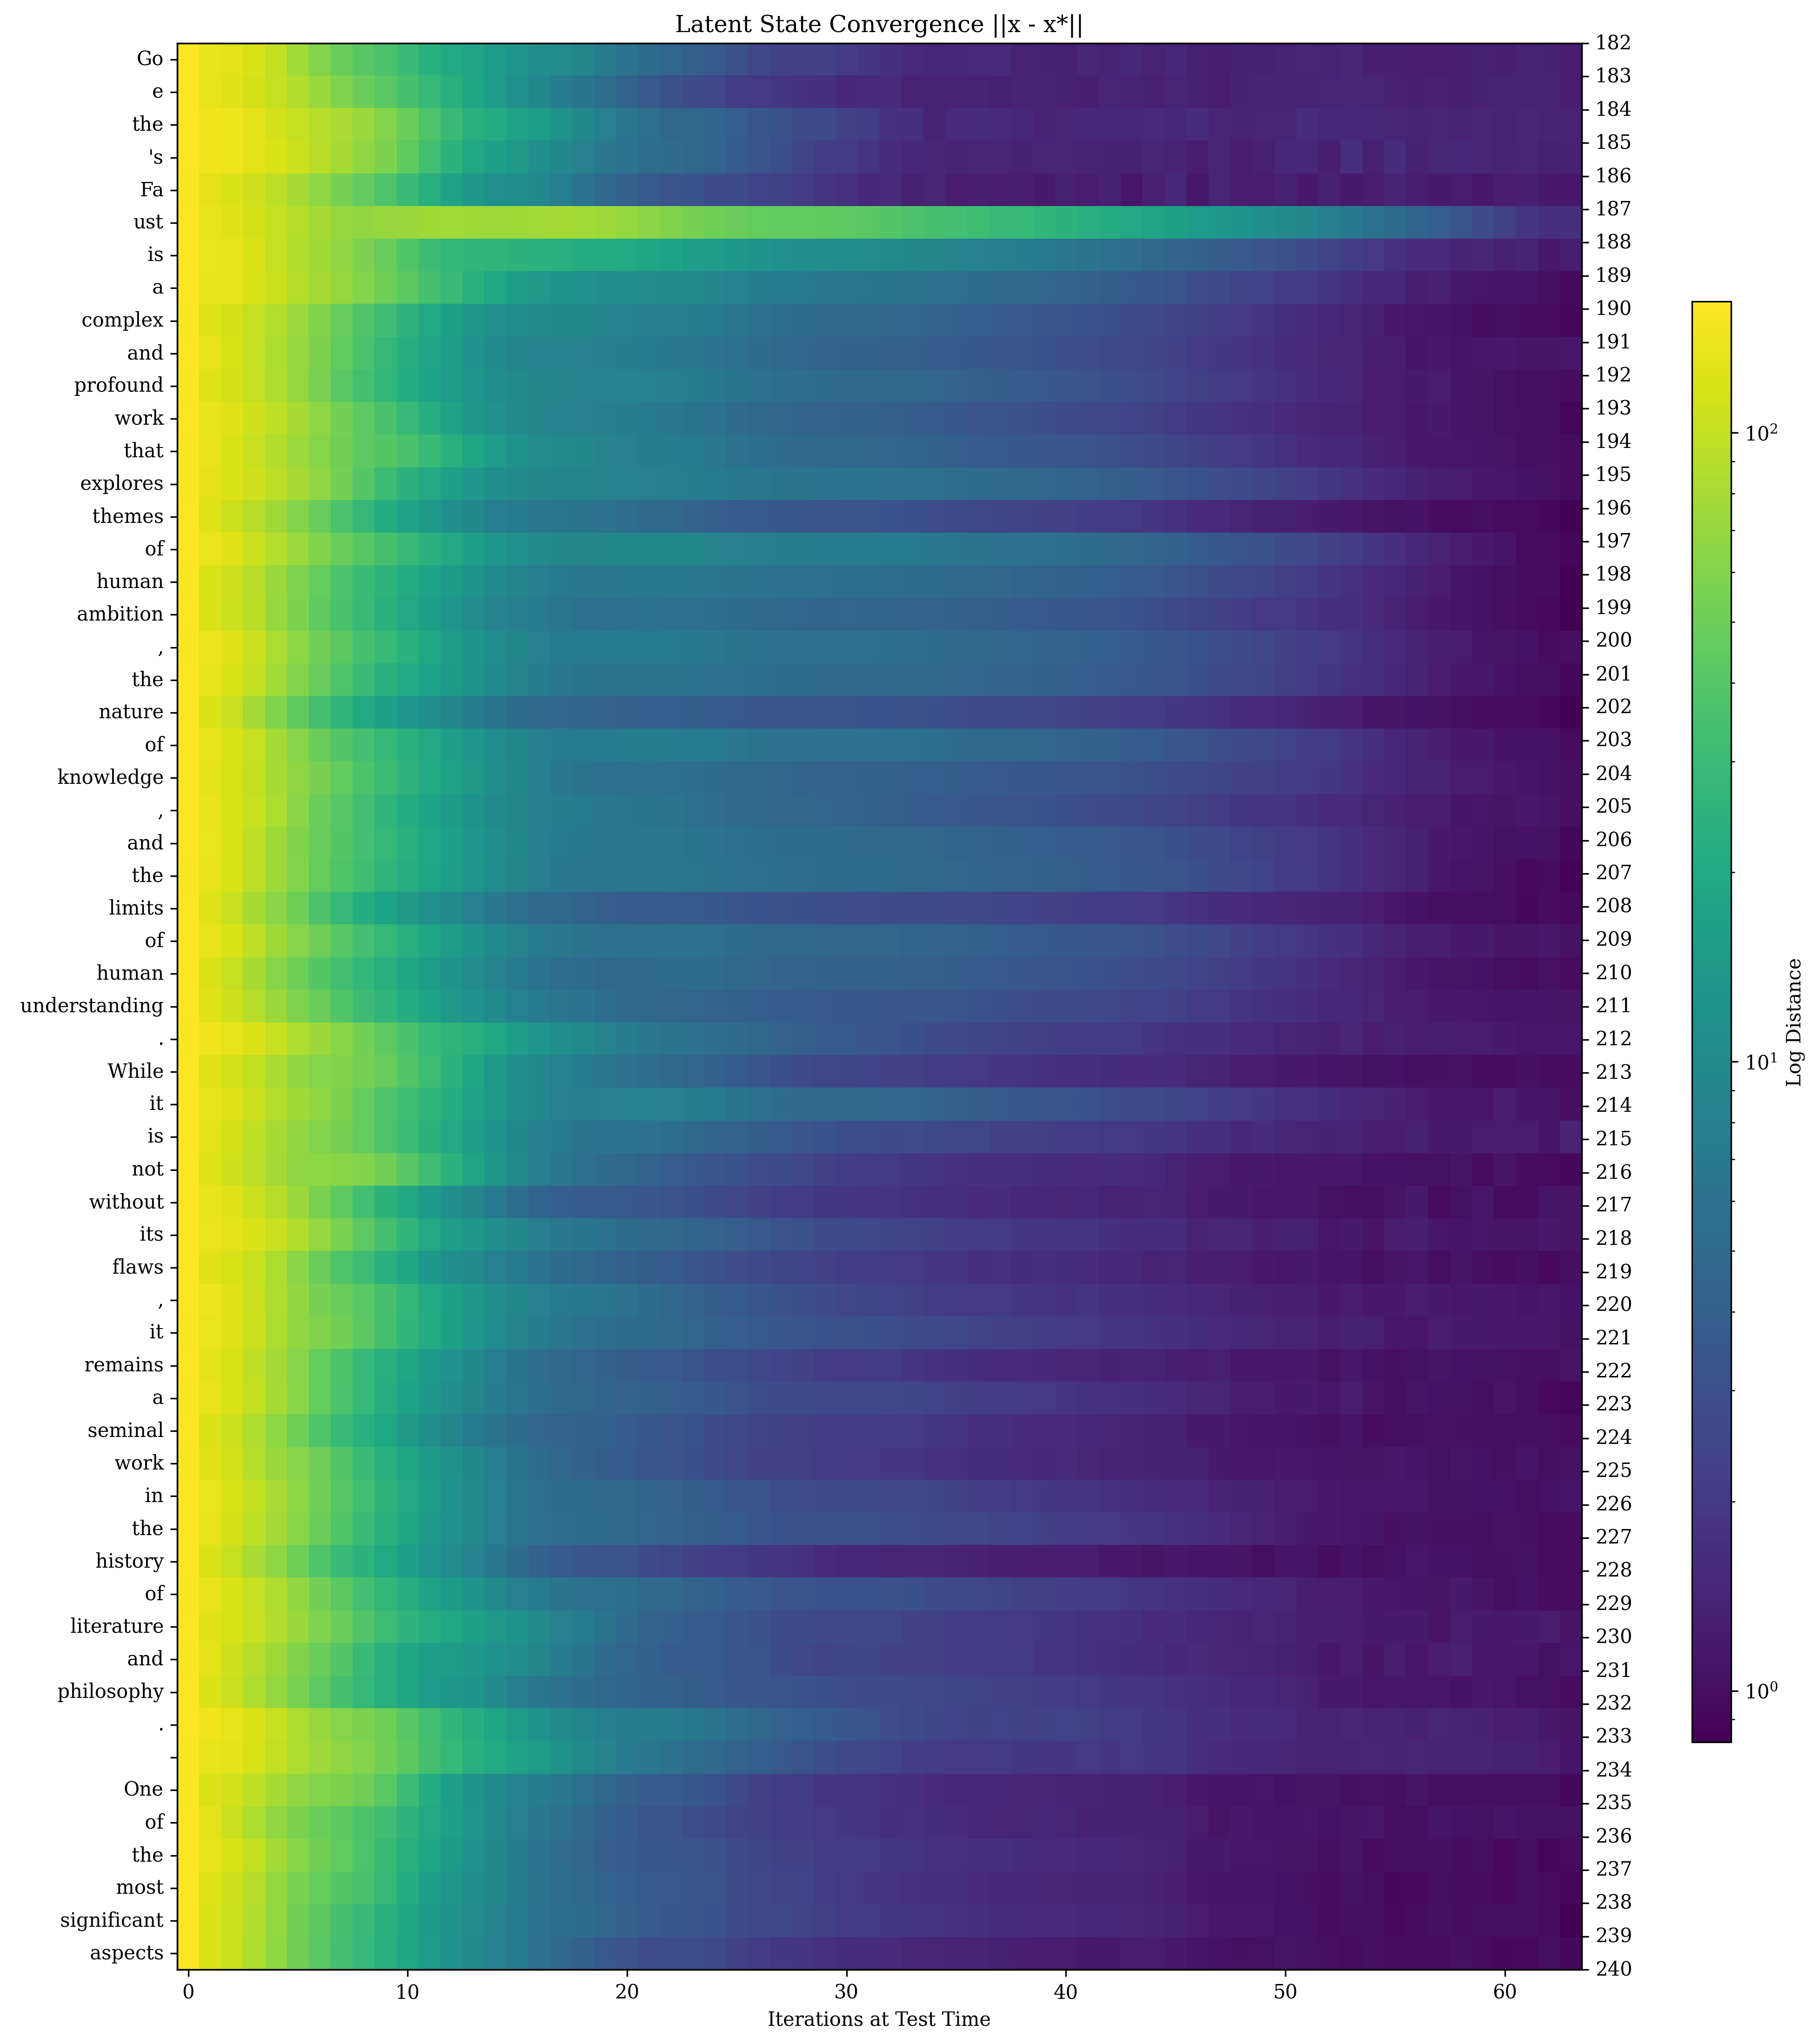
## Heatmap: Latent State Convergence
### Overview
The image presents a heatmap visualizing "Latent State Convergence ||x - x*||" against "Iterations at Test Time". The heatmap displays a color gradient representing "Log Distance", with lower values indicated by cooler colors (purple/blue) and higher values by warmer colors (yellow/red). A block of text is present on the left side of the image.
### Components/Axes
* **Title:** "Latent State Convergence ||x - x*||" (Top-center)
* **X-axis:** "Iterations at Test Time" ranging from 0 to 60, with markers at 0, 10, 20, 30, 40, 50, and 60.
* **Y-axis:** No explicit label, but represents the progression of the latent state.
* **Colorbar:** "Log Distance" on the right side, ranging from approximately 182 to 240, with a logarithmic scale indicated by "10⁰", "10¹", and "10²".
* **Text Block:** Located on the left side of the image, containing a paragraph of text.
### Detailed Analysis / Content Details
**Text Block Transcription:**
```
Goethe's Faust - is a complex and profound work that explores themes of human ambition - the nature of knowledge and the limits of human understanding. While it is not without its flaws - it remains a seminal work in the history of philosophy, highlighting aspects of the most significant -
```
**Heatmap Data Analysis:**
The heatmap shows a clear trend of decreasing "Log Distance" (convergence) as "Iterations at Test Time" increase.
* **0-10 Iterations:** The heatmap is predominantly yellow/red, indicating high "Log Distance" values, approximately between 210 and 240.
* **10-20 Iterations:** A transition zone where the color shifts from red/yellow to green/yellow, indicating a decrease in "Log Distance" to approximately 190-210.
* **20-30 Iterations:** The heatmap is primarily green/yellow, with "Log Distance" values around 182-190.
* **30-40 Iterations:** A further shift towards cooler colors (green/blue), with "Log Distance" values decreasing to approximately 182-187.
* **40-50 Iterations:** The heatmap becomes predominantly blue/purple, indicating low "Log Distance" values, around 182-185.
* **50-60 Iterations:** The heatmap remains consistently blue/purple, with "Log Distance" values stabilizing around 182-184.
The heatmap exhibits a distinct diagonal pattern, suggesting a consistent convergence rate across the range of iterations. There are no significant outliers or anomalies visible.
### Key Observations
* The "Log Distance" decreases rapidly during the first 30 iterations, then slows down and stabilizes after 50 iterations.
* The convergence appears to be relatively uniform across the latent state.
* The text block seems unrelated to the heatmap data, potentially providing context for the experiment or model being visualized.
### Interpretation
The heatmap demonstrates the convergence of latent states during a testing process. The "Log Distance" metric, representing the difference between the initial and final states, decreases as the number of iterations increases, indicating that the system is approaching a stable state. The rapid convergence in the initial stages suggests that the model quickly learns the underlying patterns, while the slower convergence in later stages indicates fine-tuning and stabilization. The consistent convergence across the latent state suggests that the model is robust and generalizes well. The presence of the Goethe's Faust text is curious; it may indicate that the model is being tested on data related to literary analysis or philosophical concepts. The text could be a prompt or a sample input used during the testing process. The heatmap provides a quantitative measure of the model's performance, while the text offers a qualitative context.